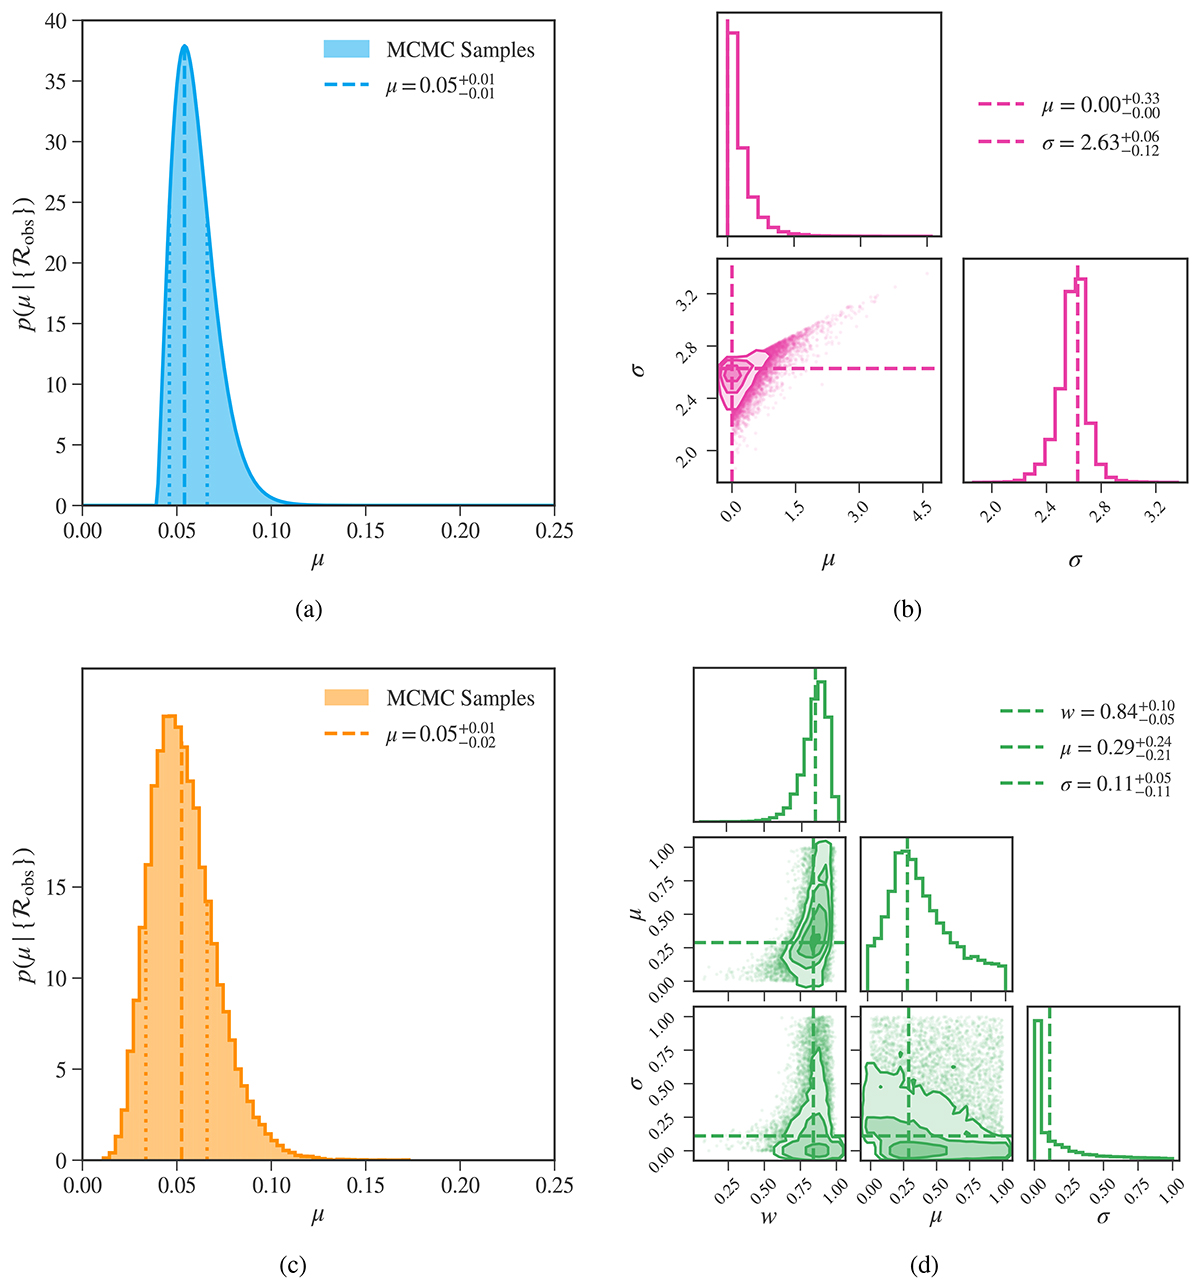
Fig. 6.
Download original image
1D and 2D marginal posterior distributions of the set of population parameters, ϕ, for each of the four models described in Sect. 4.3. The dashed lines indicate the mode of the posterior samples, and values are reported as the mode with the 68 per cent HDP interval. Panel (a): 1D marginal posterior of the population parameter ϕconst = μ (blue), describing the constant escape fraction value most likely to describe all galaxies in the sample. Panel (b): Corner plot showing the 1D and 2D marginal posterior distributions of the set of population parameters ϕlognorm (pink), describing a log-normal distribution of escape fractions. Here μ and σ represent, respectively, the mean and standard deviation of the natural logarithm of the escape fraction. Panel (c): 1D marginal posterior of the population parameter ϕexp = μ (orange), which represents the scale parameter in an exponential distribution of escape fractions. Panel (d): Corner plot containing the 1D and 2D marginal posteriors for the set of population parameters ϕbimodal (green), which describes a bimodal distribution of escape fractions: w denotes the fraction of galaxies with a constant escape fraction equal to zero, while μ and σ describe the escape fraction of the remaining galaxies as being normally distributed.
Current usage metrics show cumulative count of Article Views (full-text article views including HTML views, PDF and ePub downloads, according to the available data) and Abstracts Views on Vision4Press platform.
Data correspond to usage on the plateform after 2015. The current usage metrics is available 48-96 hours after online publication and is updated daily on week days.
Initial download of the metrics may take a while.