Fig. 5.
Download original image
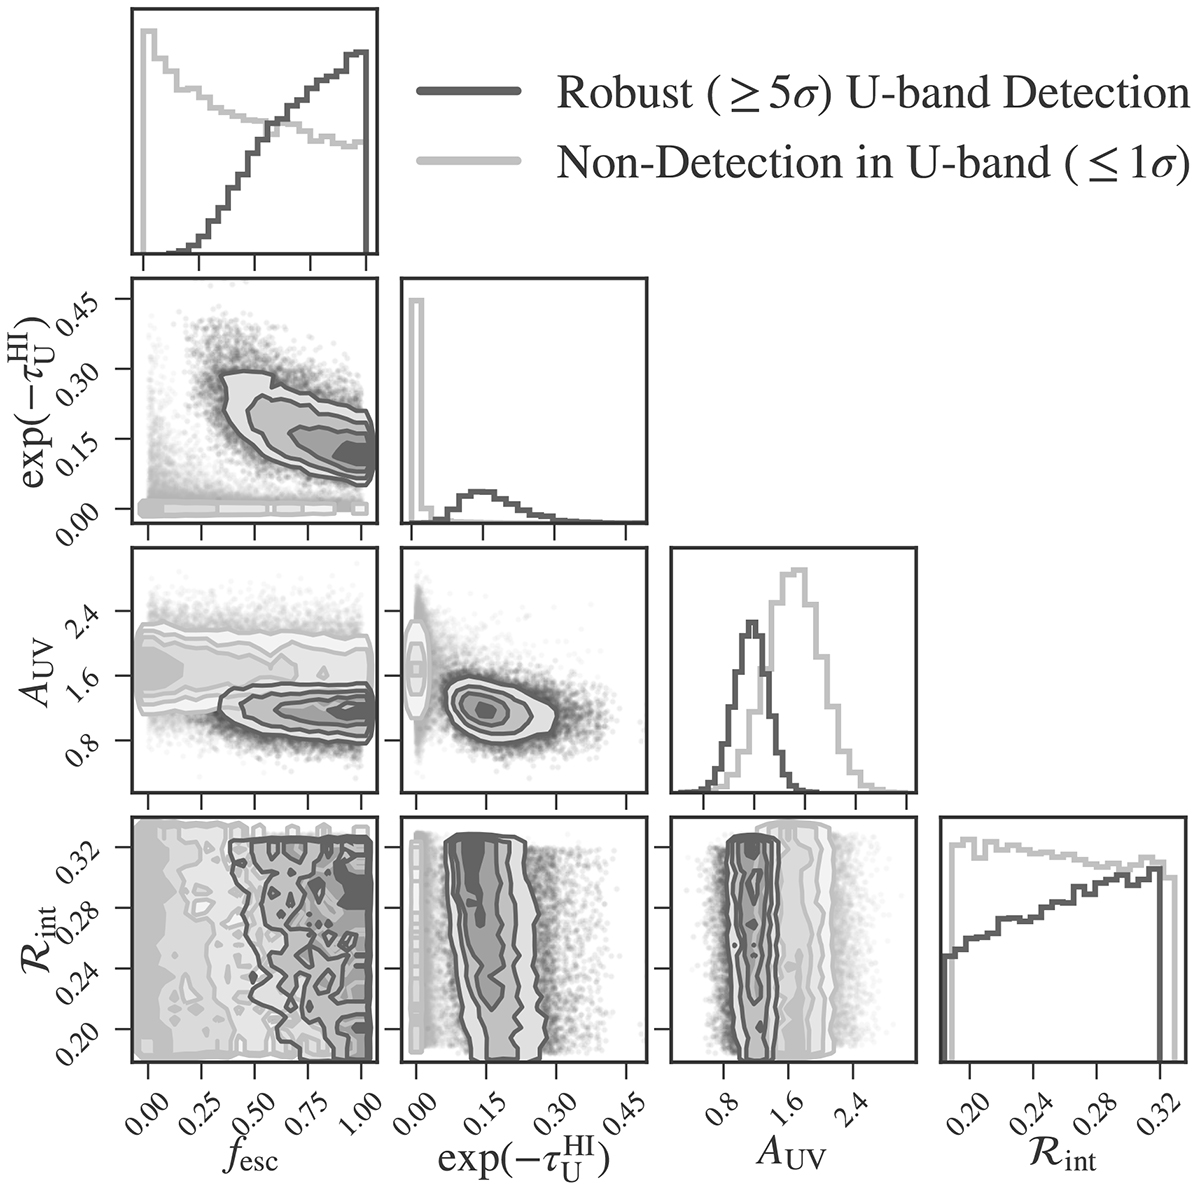
Corner plot showing the 1D and 2D marginalised posteriors for the escape fraction, fesc; the integrated transmission through the U-band filter, ![]() ; the dust attenuation at the effective wavelength of the V606 filter, AUV; and the intrinsic LyC–to–non-ionising–UV flux ratio, ℛint, for two example galaxies in our sample. In light grey we show the posterior distributions for a typical non-detection in the U-band filter (≤1σ). In dark grey we show the posterior distributions for a robust ( ≥ 5σ) ℛobs detection in the U-band, (this source, dubbed Ion1, was previously reported in Vanzella et al. 2010; Ji et al. 2020). The posteriors were obtained using an inference scheme incorporating only individual galaxy parameters, as described in Sect. 4.1.
; the dust attenuation at the effective wavelength of the V606 filter, AUV; and the intrinsic LyC–to–non-ionising–UV flux ratio, ℛint, for two example galaxies in our sample. In light grey we show the posterior distributions for a typical non-detection in the U-band filter (≤1σ). In dark grey we show the posterior distributions for a robust ( ≥ 5σ) ℛobs detection in the U-band, (this source, dubbed Ion1, was previously reported in Vanzella et al. 2010; Ji et al. 2020). The posteriors were obtained using an inference scheme incorporating only individual galaxy parameters, as described in Sect. 4.1.
Current usage metrics show cumulative count of Article Views (full-text article views including HTML views, PDF and ePub downloads, according to the available data) and Abstracts Views on Vision4Press platform.
Data correspond to usage on the plateform after 2015. The current usage metrics is available 48-96 hours after online publication and is updated daily on week days.
Initial download of the metrics may take a while.