Fig. 3.
Download original image
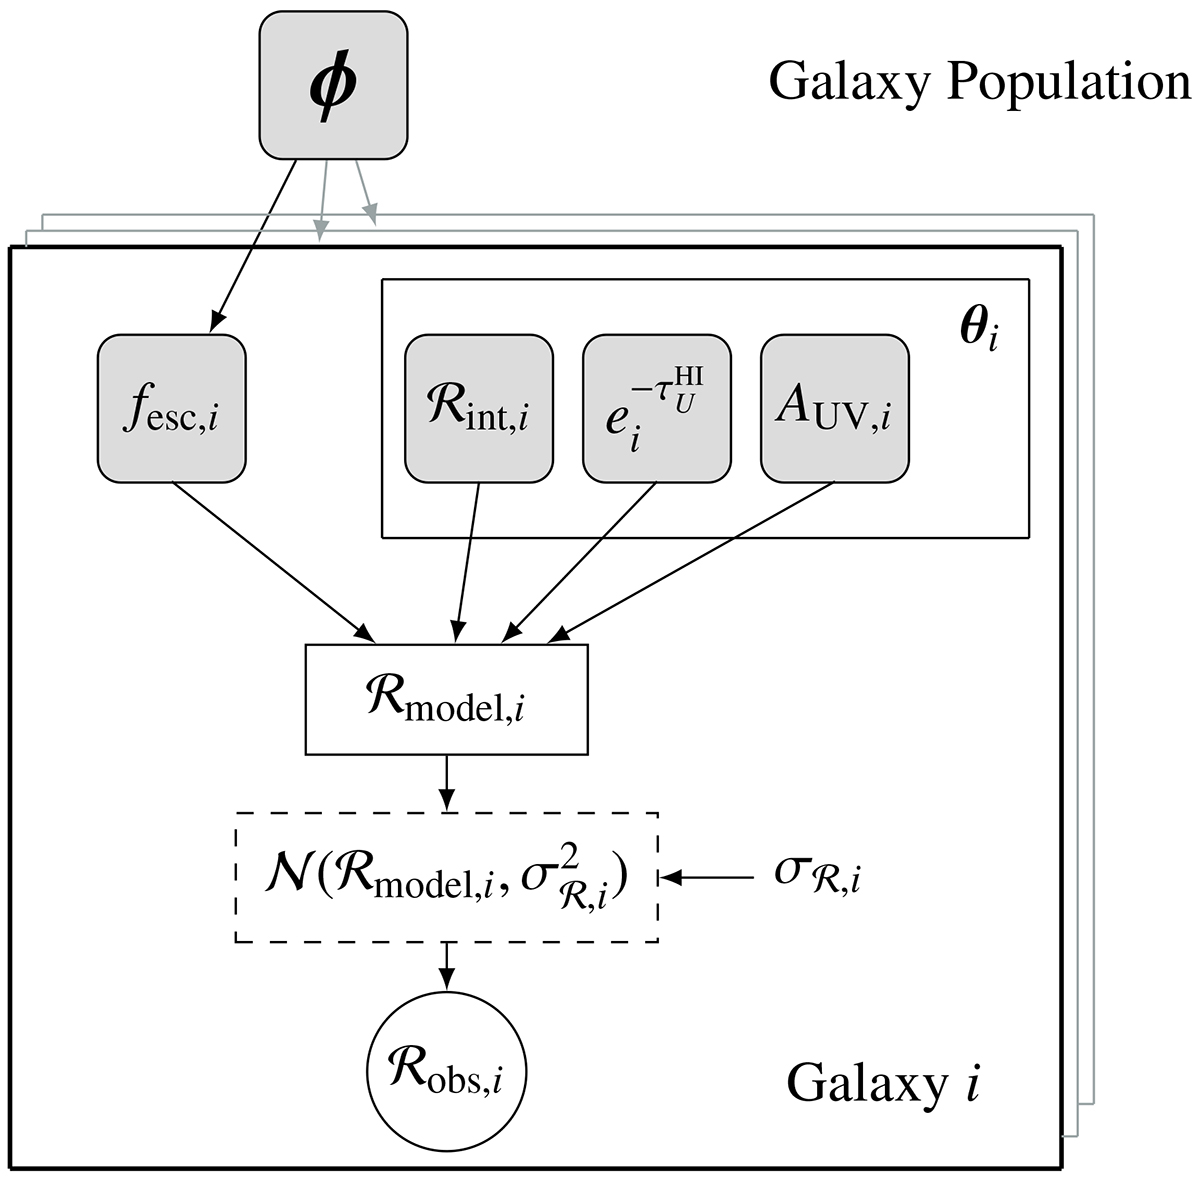
Graphical representation of the two levels in the hierarchical Bayesian inference framework. The method of inference for individual galaxy parameters (see Sect. 4.1) is contained within the main box (denoted Galaxy i), while the full figure includes the hierarchical extension to the Bayesian network incorporating the population parameters (see Sect. 4.2). The grey outlines of multiple boxes in the background indicate the conditional independence between individual galaxy observations. The filled squares denote free sampled parameters, while the rectangle with a solid border denotes a deterministic node (the value is unambiguously determined from the input parameters and Eq. 2). The rectangle with the dashed border denotes a probability distribution with which the likelihood of the observed data, denoted with a circle, is evaluated. The observational error on ℛobs, σℛ is a fixed input to the model.
Current usage metrics show cumulative count of Article Views (full-text article views including HTML views, PDF and ePub downloads, according to the available data) and Abstracts Views on Vision4Press platform.
Data correspond to usage on the plateform after 2015. The current usage metrics is available 48-96 hours after online publication and is updated daily on week days.
Initial download of the metrics may take a while.