Fig. 10.
Download original image
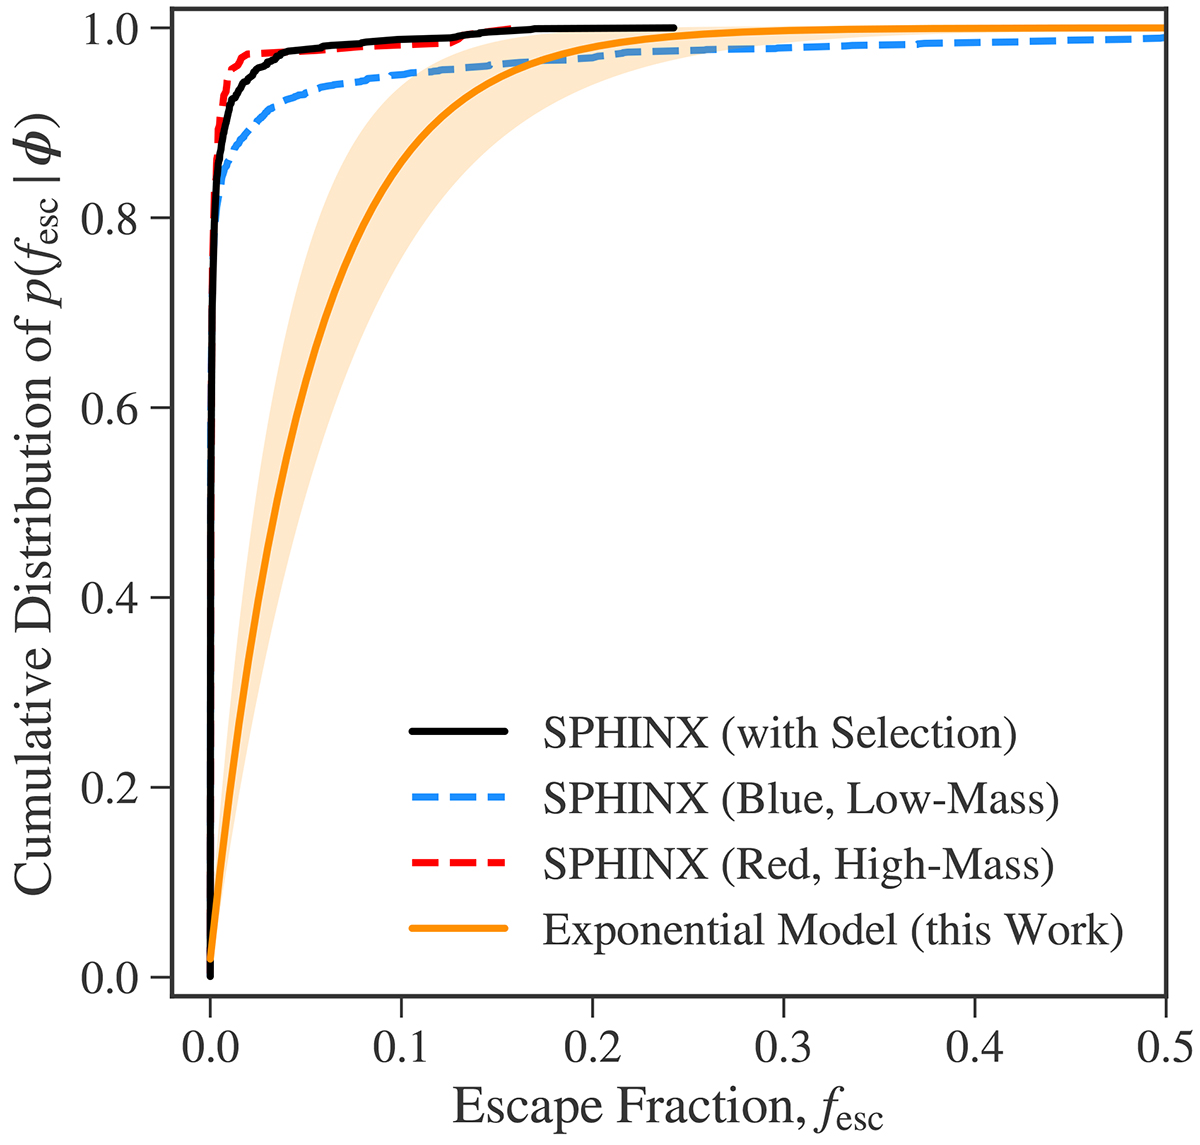
Cumulative distribution of the population distribution of the escape fraction. Shown are the median CDF for the exponential model inferred in this work (in orange; the shaded region marks the 16th and 84th percentile interval) and the eCDF for a selection of SPHINX galaxies (in black) with somewhat similar properties to our observed sample. For context, the CDF for selections of red high-mass galaxies and blue low-mass galaxies in SPHINX are plotted. All selections are described in Sect. 6.2.
Current usage metrics show cumulative count of Article Views (full-text article views including HTML views, PDF and ePub downloads, according to the available data) and Abstracts Views on Vision4Press platform.
Data correspond to usage on the plateform after 2015. The current usage metrics is available 48-96 hours after online publication and is updated daily on week days.
Initial download of the metrics may take a while.