Fig. 1.
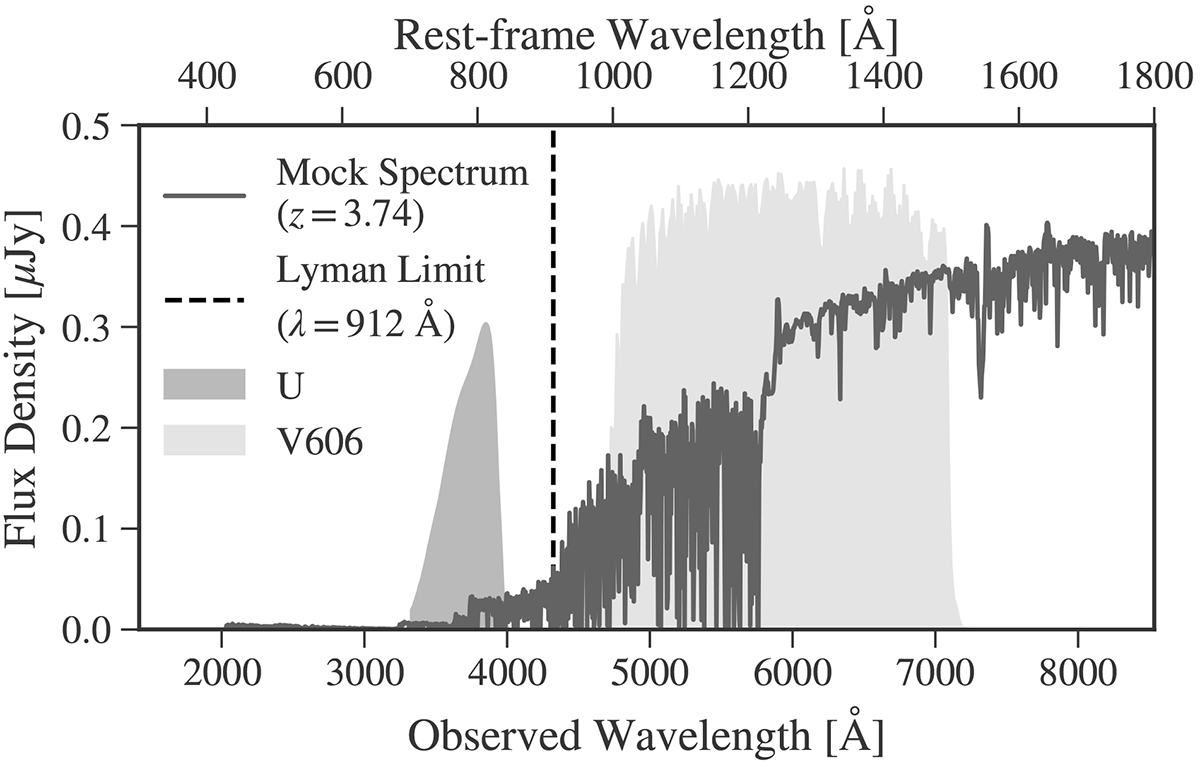
Download original image
Illustration of a mock spectrum with the U-band (LyC) and V606 (non-ionising UV) filters marked by the shaded areas. The Lyman limit is indicated with the vertical dashed black line. The fundamental observable, the LyC–to–non-ionising–UV flux ratio, ℛobs (see Sect. 2.2) measures the flux captured by the U-band (left) divided by the flux captured by the V606 filter (right). To ensure that the U-filter is always capturing flux short-ward of the Lyman limit, and is thus measuring ionising photons, we imposed a lower redshift bound of z = 3.35 on the galaxy sample. This mock spectrum was obtained from the intrinsic BPASS spectrum that was fitted to the stacked VANDELS spectrum in Begley et al. (2022) (see Sect. 3.2). The flux below the Lyman limit was attenuated according to an assumed fesc = 20%, whilst dust attenuation was applied to the non-ionising region using the Reddy et al. (2016b) dust curve and a value of AUV = 2.3. The full spectrum was multiplied with a simulated IGM transmission (exhibiting a transmitted fraction of 14% through the U filter; see Sect. 3.3).
Current usage metrics show cumulative count of Article Views (full-text article views including HTML views, PDF and ePub downloads, according to the available data) and Abstracts Views on Vision4Press platform.
Data correspond to usage on the plateform after 2015. The current usage metrics is available 48-96 hours after online publication and is updated daily on week days.
Initial download of the metrics may take a while.