Fig. 4
Download original image
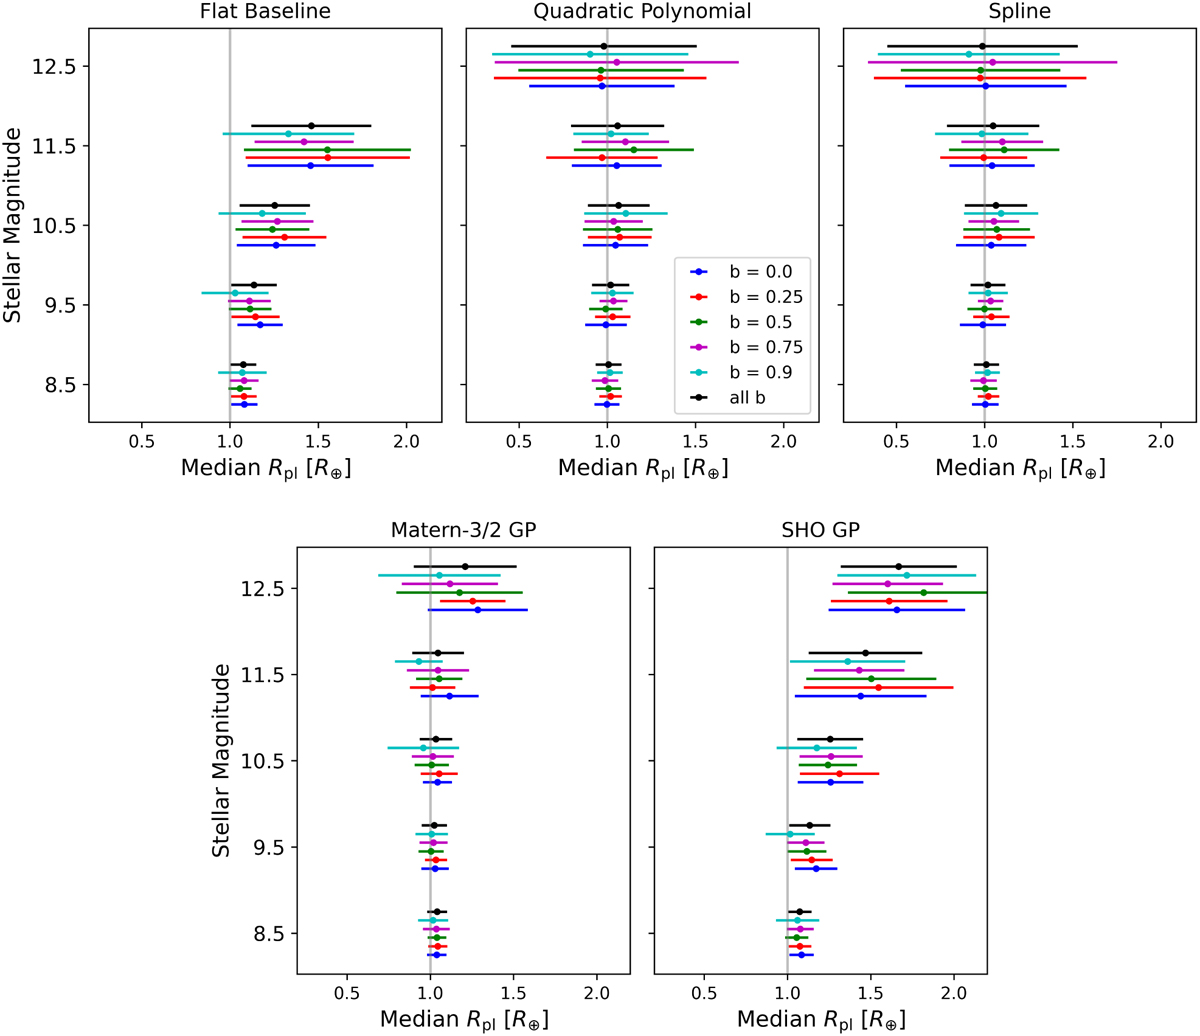
Overview of retrieved median planetary radii and their 1σ-confidence intervals as a function of the stellar magnitude and impact parameter (colour-coded) for different baseline models. Each point represents a distribution of 88 planetary radii, with each radius being retrieved from one of the 88 one-day light curves containing a single transit event. The grey vertical lines represent the injected signal. In the case of a flat baseline (FB) and stellar magnitude 12.5 the results could not be visualised because the majority of solutions are at the upper boundary of the parameter space.
Current usage metrics show cumulative count of Article Views (full-text article views including HTML views, PDF and ePub downloads, according to the available data) and Abstracts Views on Vision4Press platform.
Data correspond to usage on the plateform after 2015. The current usage metrics is available 48-96 hours after online publication and is updated daily on week days.
Initial download of the metrics may take a while.