Fig. 1
Download original image
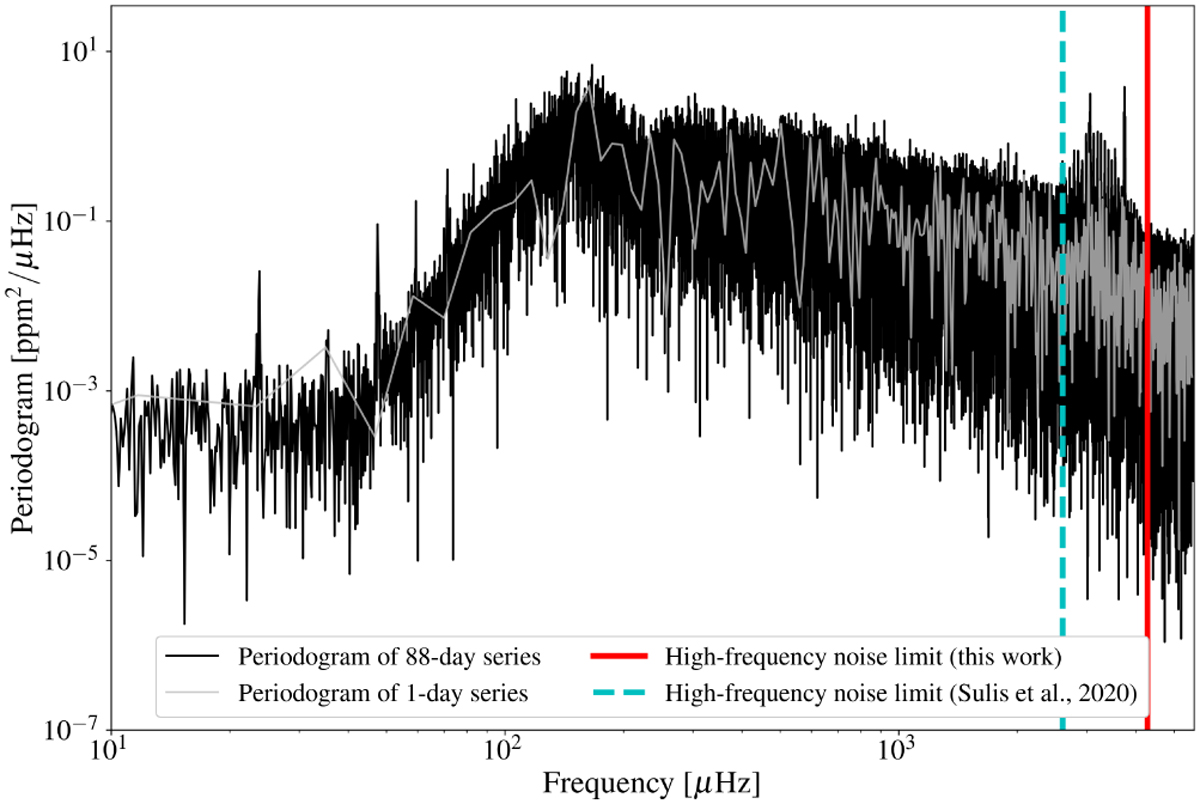
Periodogram of the 88-day HMI time series (black), with the periodogram of 1-day subseries shown for comparison (grey). The high-frequency noise of 14.8 ppm is estimated by taking the square root of the periodogram within the frequency range from 4275 µHz (red line) to the Nyquist frequency. The dashed cyan line marks the 2604 µHz frequency discussed in footnote 1. The effect of the Savitzky-Golay filter is clearly shown in the periodogram at frequency <100 µHz.
Current usage metrics show cumulative count of Article Views (full-text article views including HTML views, PDF and ePub downloads, according to the available data) and Abstracts Views on Vision4Press platform.
Data correspond to usage on the plateform after 2015. The current usage metrics is available 48-96 hours after online publication and is updated daily on week days.
Initial download of the metrics may take a while.