Open Access
Fig. 8.
Download original image
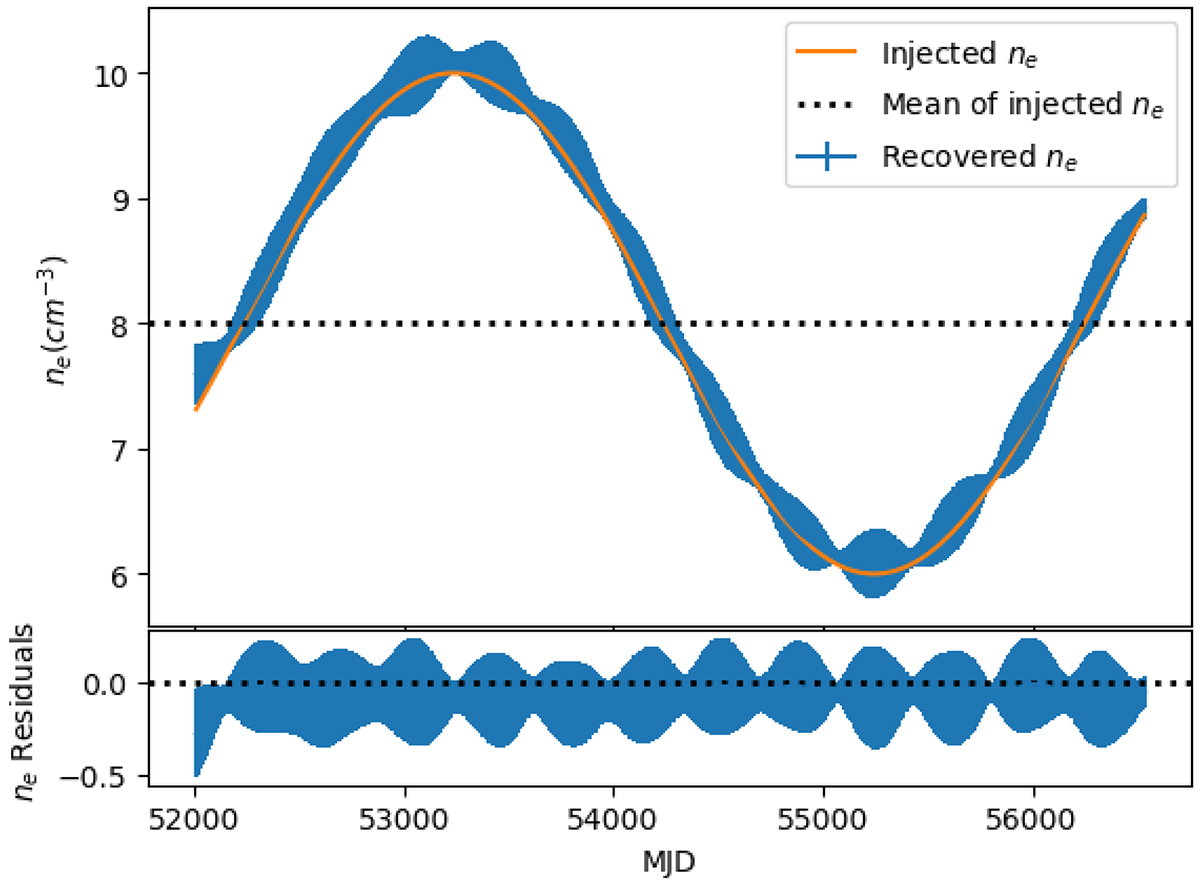
ne recovered from the recovered DM time series in Fig. 7. The orange sine curve is the ne injected into the simulations mimicking the solar activity cycle. The black dotted line represented the average of all injected ne.
Current usage metrics show cumulative count of Article Views (full-text article views including HTML views, PDF and ePub downloads, according to the available data) and Abstracts Views on Vision4Press platform.
Data correspond to usage on the plateform after 2015. The current usage metrics is available 48-96 hours after online publication and is updated daily on week days.
Initial download of the metrics may take a while.