| Issue |
A&A
Volume 698, June 2025
|
|
|---|---|---|
| Article Number | A248 | |
| Number of page(s) | 11 | |
| Section | Interstellar and circumstellar matter | |
| DOI | https://doi.org/10.1051/0004-6361/202554226 | |
| Published online | 24 June 2025 | |
Long-term timing results of ecliptic pulsars observed with I-LOFAR
1
Physics, School of Natural Sciences & Center for Astronomy, College of Science and Engineering, University of Galway,
University Road,
Galway
H91 TK33,
Ireland
2
School of Physics, Trinity College Dublin, College Green,
Dublin 2,
D02 PN40,
Ireland
3
Radio Astronomy Laboratory, University of California,
Berkeley,
CA,
USA
4
ASTRON, The Netherlands Institute for Radio Astronomy,
Oude Hoogeveensedijk 4,
7991 PD
Dwingeloo,
The Netherlands
5
Florida Space Institute, University of Central Florida,
12354 Research Parkway, Partnership 1 Building, Suite 214,
Orlando,
FL
32826-0650,
USA
6
INAF – Osservatorio Astronomico di Cagliari,
via della Scienza 5,
09047
Selargius (CA),
Italy
★ Corresponding author
Received:
21
February
2025
Accepted:
13
May
2025
Abstract
Context. Pulsar timing at low frequencies offers a powerful tool for studying the interstellar medium. Additionally, pulsar observations in the ecliptic enable us to study the effects of the solar wind, which becomes much more prominent at low radio frequencies. The Irish station of the LOw Frequency ARray (I-LOFAR) is a sensitive low-frequency radio telescope capable of delivering high-precision data for pulsar studies.
Aims. We present a comprehensive dataset of times of arrival, timing solutions, and dispersion measure (DM) time series for seven ecliptic pulsars observed over two to three years with I-LOFAR. The primary objectives are to investigate time-dependent dispersion effects and provide high-precision timing data for pulsar timing experiments.
Methods. We measured DM variations through pulsar timing and analysed them across different ecliptic latitudes to assess the impact of the solar wind on each pulsar. We modelled the intrinsic pulse-profile variability as a function of frequency.
Results. The high-precision DM time series for all seven pulsars exhibit clear variations that are dependent on their ecliptic latitudes, revealing the impact of the solar wind. Some pulsars show significant changes in their pulse widths across the frequency band, while others remain stable. We examined and quantified the pulse-nulling present in PSR J0826+2637, report evidence of DM chromaticity in PSR J1645-0317, and describe how PSR J2145-0750’s DM precision is such that it could resolve the ionospheric DM contribution. This makes it a target of interest for telescopes in areas of the globe where the ionospheric electron density is higher, for example the Murchison Radio Observatory in Australia.
Conclusions. This data release underscores the potential of I-LOFAR, or any stand-alone international LOFAR station, for advancing low-frequency pulsar studies, particularly in analyses of dispersion in the interstellar medium, the solar wind, and the ionosphere.
Key words: gravitational waves / methods: data analysis / solar wind / pulsars: general / ISM: general
© The Authors 2025
 Open Access article, published by EDP Sciences, under the terms of the Creative Commons Attribution License (https://creativecommons.org/licenses/by/4.0), which permits unrestricted use, distribution, and reproduction in any medium, provided the original work is properly cited.
This article is published in open access under the Subscribe to Open model. This email address is being protected from spambots. You need JavaScript enabled to view it. to support open access publication.
1 Introduction
Pulsars are highly magnetised, fast-spinning neutron stars, the remnants of massive stars following a supernova (Gold 1968; Lorimer & Kramer 2004). Pulsars emit beams of electromagnetic radiation from their polar regions (Contopoulos et al. 1999; Michel & Li 1999; Philippov et al. 2015); as their magnetic and rotational axes are generally misaligned, these beams sweep across space while the star rotates. When one of the beams cuts through the line of sight (LoS) of an observer from Earth, regular pulses of radiation are observed, which are particularly prominent at radio frequencies. These pulses, when folded over the rotational period, form a characteristic pulse profile that is stable over time (Helfand et al. 1975; Liu et al. 2012). This makes pulsars ideal for a number of experiments based on the technique of pulsar timing (see e.g. Stairs 2003 and references therein). Pulsar timing is a process that entails the recording of the times of arrival (ToAs) of pulses emitted from a given pulsar (Edwards et al. 2006). ToAs are derived by cross-correlating a pulsar signal integrated over many rotation periods, typically 104 to 105, with a high signal-to-noise ratio (S/N) template (Taylor 1992). Given the stability requirement, high-precision pulsar timing (with a residual rms lower than 1 μs) is achieved by long-term monitoring of millisecond pulsars (MSPs; see Backer et al. 1982) rather than pulsars in general, the majority of which rotate with periods on the order of half a second or more. Several phenomena introduce noise into the timing model (see Verbiest & Shaifullah 2018 for a review). Among these noise sources are gravitational waves (GWs), which can be systematically identified by examining correlated patterns in the residuals across an array of pulsars (Hellings & Downs 1983); this approach underlies the concept of pulsar timing array (PTA) experiments. The current state of the art (Verbiest et al. 2024) has seen hints of such a correlated signature in data from various PTA consortia at a significance level, from 3 to 4.2σ (Antoniadis et al. 2023a; Agazie et al. 2023; Reardon et al. 2023; Xu et al. 2023; Agazie et al. 2024). In identifying any GW signal in PTA datasets, one of the most challenging signatures to disentangle is that of the ionised interstellar medium (IISM). The IISM noise process can dominate the GW background if not modelled properly, but its inverse dependence on the squared of the observing frequency offers a leverage to implement effective mitigation techniques, especially thanks to the usage of low-radio-frequency pulsar data. One of the best ways to characterise the IISM noise process is to observe pulsars with facilities that reach radio frequencies of <1 GHz and large fractional bandwidths (Verbiest & Shaifullah 2018).
This paper presents a study of seven pulsars observed between 100 and 200 MHz with high fractional bandwidth over the last two to three years, using the Irish station of the Low Frequency Array (LOFAR; see van Haarlem et al. 2013), hereafter referred to as I-LOFAR (also known as IE613). These seven pulsars are located near the ecliptic plane with various ecliptic latitudes (ELATs); as such, their signal traverses the solar wind (SW) once per year during their solar conjunctions, offering an excellent means of assessing the solar contribution to the IISM signature. The data products developed as part of this work have been made publicly available (Susarla 2025)1.
This paper describes these data and our pipelines, and illustrates some of the enabled scientific investigations. In Sect. 2, we outline the dataset and our data collection methods, including choices made for the observational settings and the initial processing steps. In Sect. 3, we describe the post-processing techniques applied to the data. Section 4 presents the results and discusses their implications. Finally, Sect. 5 concludes with a summary of the findings and future research directions.
2 I-LOFAR: Telescope and observing campaign
In this section, we describe the I-LOFAR telescope used for this study and its configurations for pulsar data collection. We also describe the selection criteria that led to the choice of the observed pulsars.
2.1 I-LOFAR telescope
LOFAR is a pan-European radio telescope array consisting of 52 stations from as far west as Ireland to as far east as Latvia. The core of the array is in the Netherlands where there are 24 core stations centred on a ‘superterp’ near Exloo, the Netherlands. There are a further 14 remote stations within the Netherlands and 14 international stations. The whole array is currently being upgraded (LOFAR Collaboration 2023) in order to, amongst other improvements, increase the instantaneous bandwidth and the clock distribution. Furthermore, two new international stations, in Italy and in Bulgaria, will soon join the array, significantly improving its north-south extent. The dataset collected with the Irish LOFAR station, is the subject of this paper. I-LOFAR is located at the Rosse Observatory2 in Birr, County Offaly, in the centre of the island of Ireland. During the observing campaign, I-LOFAR operated in stand-alone mode for typically 31 hours per week and it was within this allocation, over the past three years that data were collected for the presented project. The I-LOFAR high-band antennas (HBAs) were used, observing between 100 and 200 MHz. For each observation, the HBAs were analogue-beam-formed in the direction of the target with the resultant data sampled using a 200 MHz clock, resulting in one real data sample per antenna polarisation every 5 ns. A coarse channelisation is performed using a polyphase filterbank, which creates 512 channels of complex voltage data per polarisation every 5.12 μs. The hardware limits the accessible data to 488 of these 512 sub-bands for 8-bit recording. The data in the vicinity of the FM (frequency modulation) band contain no useful information due to a hardware filter. As a result, only sub-bands 12–499 were retained for the final dataset, which correspond to a lowest and highest topocentric frequency of about 102.2461 and 197.5586 MHz.
2.2 Pulsar selection
Since its inception, I-LOFAR has been conducting pulsar observations. For this study, we focused on a carefully selected sample of seven pulsars observed consistently over a two to three year period, each satisfying the condition |ELAT| < 20°. These pulsars were chosen based on the list published in Tiburzi et al. (2021), ensuring a wide temporal coverage of solar conjunctions throughout the year. Our aim was twofold: to enhance the cadence of the low-frequency dataset contributed to the International PTA (IPTA) database (Perera et al. 2019) for the PTA pulsars and to ensure a robust data coverage for studying SW effects. To finalise the sample, we observed all pulsars listed in Tiburzi et al. (2021) at least once to determine optimal integration times while adhering to the telescope’s operational limit of 60 minutes per observation. Given the weekly constraint of a maximum observing time of 31 hours, we selected the seven best sources, optimising the sample based on available time and ensuring a spread in right ascensions. Out of the seven selected sources, two are part of PTA samples.
Figure 1 displays the location of these pulsars relative to the Sun’s path over a year. Notably, each pulsar’s LoS aligns closely with the Sun at different times of the year, depending on its right ascension. Table 1 provides a summary of key properties for these pulsars, including the median S/N, which indicates their relative brightness in the LOFAR (HBA) frequency range.
2.3 Dispersion measure precision
As an electromagnetic wave traverses the IISM, it undergoes dispersion due to the free electrons present in it. This effect is characterised by the dispersion measure (DM) parameter, defined as the total electron density along the LoS between Earth and a pulsar, affecting the arrival times of radio pulses by causing frequency-dependent delays. The DM of a pulsar is given by the integral of the column density  along the LoS:
 (1)
(1)
The dispersion causes a delay in the arrival of pulsar emission that depends on both the frequency of the radiation and the DM parameter, expressed in units of pc cm−3. This delay can be calculated as
 (2)
(2)
where KD is the dispersion constant, and v is the observing frequency in MHz. The constant KD itself is a combination of physical constants, each measured to some finite level, and SI (Système International) conventions. We adopted a standard pulsar timing convention to fix this constant at the exact value of KD := 2.41 × 10⁻⁴ MHz−2 pc cm−3 s−1 (Lorimer & Kramer 2004). This is consistent with the relevant pulsar software packages, namely DSPSR (van Straten & Bailes 2011) and TEMPO2 (Hobbs et al. 2006). As the dispersion delay is inversely proportional to the square of the frequency, it becomes significantly more pronounced at low frequencies. In this study, the average DM precision obtained on an individual observation across all pulsars is 1.2 × 10⁻⁴ pc cm−3.
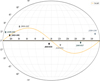 |
Fig. 1 Aitoff projection of the locations of the pulsars listed in Table 1. The pulsars are shown as star symbols and the ecliptic plane with a yellow dashed line. |
Key properties of the observed ecliptic pulsars presented in this study.
2.4 Observations and data analysis
During the stand-alone time, regular observations of the seven chosen pulsars were conducted over the course of two to three years, accumulating a total of ∼240 hours of combined observations. Science-ready data products were produced using the REAL-time Transient Acquisition backend (REALTA; Murphy et al. 2021). Baseband voltages were recorded to disk, and UDP-PACKETMANAGER (McKenna et al. 2024) was used to create intermediate data products in the PS RDADA3 format from these voltages. Furthermore, coherent de-dispersion is applied to the baseband voltages using the digifil tool of DSPSR. Coherent de-dispersion is a technique wherein an input signal is convolved with the inverse transfer function of the IISM, effectively removing the dispersion delay signature caused by free electrons along the LoS (Hankins & Rickett 1975). Dual-polarisation complex products are produced for each observation, which were then converted into SigProc (Lorimer 2011) filterbank files using the digifil tool with a frequency resolution of 24.41 kHz and source-dependent temporal resolution of at least 81.92 μs. The filterbanks are then converted into TIMER archive (Hotan et al. 2004) files, a standard pulsar data format, by folding them using dspsr.
3 Data processing
The final data have a central frequency of 149.902 MHz and were coherently de-dispersed to this frequency. Then, they were folded into 10 s sub-integrations using the DSPSR software suite. Oncethe archives were created according to these specifications, several post-processing steps were applied. In the post-processing phase, each observation was cleaned of radio frequency interference using a modified version of the COASTGUARD software package (see Lazarus et al. 2016; Kuenkel, in prep.4) and corrected for parallactic angle rotation and projection effects (Jones 1941; Hamaker et al. 1996) with the DREAM BEAM software package5. Each observation was then time-averaged and partially frequency-averaged to ten frequency sub-bands using the PSRCHIVE software suite (Hotan et al. 2004; van Straten et al. 2012). The final bandwidth was cut to range from 112 to 190 MHz, as a small portion of the wider band was affected by consistent radio frequency interference and the edges of the high and low pass filters present in the system.
3.1 Creation of templates
All time-averaged archives, except those within 45 degrees of the Sun, are combined using the psradd tool from PSRCHIVE to make one individual archive file. For PSR J0034-0534, given its complexity, we selected the highest S/N observation instead of adding all the observations. We then frequency-averaged the channels down to 10 and smoothed such data-derived templates with the wavelet-smoothing technique offered by the psrsmooth tool. This process was performed iteratively after optimising the pulsar model (or ephemeris) via the timing technique (see Sect. 3.2), updating the archives’ ephemerides to ensure accurate DM values in the profiles. The presence of any residual dispersion in the final template was checked using the pazi module, with corrections applied to the DM as needed. The result is a high-S/N, noiseless template (see Fig. 2).
3.2 Pulsar timing
The procedure described in the previous section is used to create a preliminary template from all of the cleaned archives. ToAs were then created for each observation (that was time-averaged and frequency-averaged down to 10 channels) and channel via cross-correlation with the template. This ensemble of ToAs was used to generate timing residuals and to fit a stable timing solution. TEMPO2 is utilised to fit for various timing parameters, including position, proper motion, spin frequency and its derivatives, DM and its derivatives, and binary parameters for binary pulsars. This fitting process is typically repeated, until a stable timing solution is obtained. The two PTA sources in our sample, PSRs J1022+1001 and J2145 −0750, are usually provided with an already, relatively stable timing solution thanks to the European PTA Data Release 2 (Antoniadis et al. 2023b). Once a reliable timing solution was obtained, the new ephemeris file was installed in the original observations, which were then time- averaged again. These archives were again used to make the final template repeating the procedure mentioned in Sect. 3.1.
3.3 Obtaining DM time series
Using the noise-free template generated by the methods in Sect. 3.1, the pat module was employed to produce topocentric ToAs for each frequency channel. Following Tiburzi et al. (2019) and Donner et al. (2020), a DM time series was generated using an approach known as the ‘epoch-wise’ method (Iraci et al. 2024). This technique fits the ToAs belonging to the same observing epoch to the functional form shown in Eq. (2) using tempo2 (Hobbs et al. 2006), to obtain the residual DM induced by the added time delay. The result is a DM measurement per epoch. All data products – including the DM time series, timing solutions, and ToAs – were obtained concurrently using the methods described in this section. The resulting spin and orbital parameters for all pulsars are summarised in Table 3.
DM median and minimum uncertainties for selected pulsars observed with I-LOFAR.
4 Results and discussions
This section outlines the properties of each pulsar. As already mentioned, PSRs J1022+1011 and J2145 −0750 are included in the samples of the European and International PTAs; they are old, recycled pulsars with periods of less than 20 ms. Their stability and predictability make them ideal candidates for precision pulsar timing and for GW studies (Verbiest et al. 2016; Perera et al. 2019).
4.1 DM time series
The DM time series are displayed in Fig. 3, with red points marking epochs when the pulsar’s LoS comes within 45° of the Sun. Significant fluctuations in the DM time series are observed especially for PSRs J0034-0534, J0826+2637, J1022+1001, and J2145-0750 as their LoS near the Sun. These emphasise their potential for studying SW effects, as their ELATs make them ideal candidates for such investigations using pulsars.
Other pulsars, such as PSRs J1300+1240 and J1645-0317, show gradual trends in their DM time series, indicating potential variations in the IISM electron content along their LoS. These gradual changes may reflect evolving electron densities within the IISM, highlighting the importance of studying long-term dispersion effects with low-frequency observations. Table 2 provides details of each pulsar along with their DM uncertainty. Some pulsars demonstrate exceptionally high DM precision, suggesting that our observations are approaching the sensitivity needed to detect ionospheric variations within the DM time series. If we consider a total electron content of the ionosphere to be 10–60 TECU (1 TECU = 1016 electrons/m2), which is the normal value over a full day at Birr (see Kriegel & Berdermann (2020)6 for TECU maps), using Eq. (22) in Bray et al. (2015), we get a DM contribution of 3 × 10⁻⁶−1.9 × 10⁻⁵ pc cm−3. The high fractional bandwidth and enhanced sensitivity of future instruments like the Square Kilometre Array (SKA; Braun et al. 2019) will enable significantly improved precision, providing a promising avenue for detailed investigations of the ionosphere using pulsars.
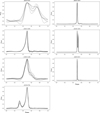 |
Fig. 2 Frequency evolution of normalised pulse profiles. Darker shades correspond to a high frequency and vice versa. |
4.2 Frequency evolution of pulsar pulse profiles
Multi-frequency pulse profiles offer crucial information on pulsar emission geometries, including emission region heights, beam shapes, and radius-to-frequency mapping (Lyne & Manchester 1988; Rankin 1983a,b; Mitra & Deshpande 1999; Hankins & Rankin 2010; Hassall et al. 2013). A comprehensive study of 74 pulsars by Xu et al. (2021) provided significant information on the frequency evolution of pulse profiles. For 71 pulsars, the pulse width W50 (the full width of the pulse profile at 50% of the peak profile amplitude), follows a power-law trend at both high and low frequencies. However, deviations from this power-law behaviour were observed in the mid-frequency range (100–800 MHz), consistent with absorption characteristics proposed for the first time by Rankin (1983b).
Following Xu et al. (2021), we used the full width at half maximum (FWHM) as a metric to study the beam widths as a function of frequency of the pulsars in our sample at the exceptionally long wavelengths offered by I-LOFAR. We obtained W50 by fitting multiple Gaussians, i.e.
 (3)
(3)
where Ai, μi, and σi are amplitude, mean, and standard deviation of the ith Gaussian component. The W50 and its uncertainty  are then given by
 (4)
(4)
where  is the uncertainty on the standard deviation of the Gaussian component. For pulsars with multiple peaks exceeding 50% of the peak amplitude, where the intervening trough falls below this threshold, such as certain frequency profiles of PSR J0034-0534 and all profiles in PSR J1136+1551, we manually measured W50 as the individual W50,i values or their sum did not accurately represent the beam width. This is the reason why the W50 values for PSR J1136+1551 appear to be quantised. To get the error on the FWHM, we used the quadrature sum of the
  of the individual Gaussian components. The frequency evolution of these pulsars is fit with a power-law function of the form W50 ∝ fα.
Figure 4 shows W50 as a function of observing frequency. We see that for some pulsars, the W50 values lie below the power-law fit. These so-called absorption features could pose challenges to the conventional pulsar radiation models (Rankin 1983b; Xu et al. 2021). They are attributed to cyclotron absorption and it is likely magnetospheric in origin (Bartel 1981). Most pulsars exhibit a general trend of decreasing pulse width with increasing frequency. This is the trend expected from a radius- to-frequency mapping along primarily dipolar field lines where higher-frequency emission originates closer to the stellar surface (Ruderman & Sutherland 1975). However, exceptions exist, notably PSR J0034-0534, whose W50 values appear to increase as a function of frequency. Conversely, PSR J1022+1001 shows minimal changes in W50 across a wide frequency range, indicating stable profile morphology. PSR J0826+2637 agrees with the findings of Rankin (1983b) and Xu et al. (2021), with a steady decrease in their pulse widths over the observed frequency range showing no noticeable absorption features. Whereas, PSRs J1300+1240, J1645-0317 and J2145-0750 show absorption features in the LOFAR band itself. To address these exceptions, we also analysed the values of full width at 10% of maximum (W10) as, depending on the particle profile shape (i.e. on the viewing geometry), different width metrics might be more representative of the emission beam widths (Lyne et al. 2010). We saw similar trends across the entire frequency range for all sources, with the exception of PSR J2145-0750 where its W10 values seemed to be increasing with frequency, contrary to its W50 trend as shown in Fig. 7. This might imply that emission from the centre and edges of the beam are not coming from the same height above the surface for the same frequency, i.e. the radius to frequency mapping does not hold.
These findings underscore the importance of having a high fractional bandwidth. SKA1-Low, which is currently under construction in Western Australia, has a 7:1 instantaneous fractional bandwidth (Braun et al. 2019) providing the coverage that should enable comprehensive measurements of these trends in the southern pulsar population and provide unique constraints on pulsar radiation models. With the aforementioned observed behaviour, and as a very bright source in this band, PSR J2145-0750 is an obvious target for SKA1-Low even in the very early array assemblies.
Spin and orbital parameters of the seven pulsars in our dataset.
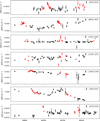 |
Fig. 3 DM time series of each pulsar. The red points in each panel are the epochs that are less than 45 degrees from the Sun. |
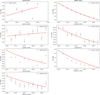 |
Fig. 4 FWHM pulse widths for the pulsars in our dataset. The black stars represent the pulse width at each frequency, with the corresponding error in measurement. The red lines in each panel are the power-law fits on the FWHM values. The FWHM values that lie below the power-law fits correspond to the absorption features, which can be seen most prominently in PSRs J1300+1240 and J1645-0317 |
4.3 PSRJ0034-0534
PSR J0034-0534, classified as a binary MSP (Bailes et al. 1994), is one of the most precisely timed pulsars at low frequencies. We report a DM of 13.764996 ± 0.000015 pc cm−3 with a remarkable median uncertainty of 7.9 × 10⁻⁵ pc cm−3 for all observations. This high precision in DM measurements allows it to serve as an excellent probe for detecting subtle DM variations due to effects such as the SW and the ionosphere. With a rotational period of 1.8 ms, J0034-0534 has the third shortest period known among pulsars. It orbits a white dwarf companion in a 1.6 day binary system.
It has a broad integrated pulse profile with a minimal off- pulse region at 150 MHz. This can be observed in the template profile shown in Fig. 2. The timing residuals have an rms uncertainty of 18.54 μs as shown in Fig. 5. Notably, for this pulsar the upper three frequency channels were excluded from the analysis due to the complete absence of signal. This manual procedure was required, likely as a result of the source’s very steep spectrum. Additionally, the exceptional DM precision of J0034-0534 provides evidence of potential asymmetry in SW-induced DM variations around solar conjunction, as noted in previous studies (Tiburzi et al. 2019; Susarla et al. 2024). Further investigation, ideally involving daily observations around solar conjunction, would be valuable to determine the sensitivity of this pulsar to such effects.
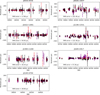 |
Fig. 5 Residuals after timing using tempo2. The different colours are representative of different frequencies. |
4.4 PSR J0826+2637 (B0826+23)
One of the earliest discovered pulsars, PSR J0826+2637, was first identified by Craft et al. (1968) with a rotation period of 530 ms. Using the I-LOFAR dataset, we report a DM of 19.504089 ± 0.00009 pc cm−3 with an rms error in timing residuals of 101.40 μs. Although it is among the brightest known pulsars, it exhibits complex emission characteristics that have been investigated extensively in studies such as Sobey et al. (2015) and Rankin et al. (2020).
This pulsar displays two primary emission states: the bright, or ‘B’ mode, and the quiet, or ‘Q’ mode. The Q mode is characterised by weak and sporadic emission. Additionally, Sobey et al. (2015) suggests the possible existence of a third, precursor mode with even lower flux that occasionally drops to zero, potentially reflecting magnetospheric processes; however, confirming this hypothesis requires an extended observation window.
Figure 6 shows the two modes observed during the observation on April 18, 2023. The pulsar appears to be very weak in the Q mode, as evidenced in many observations where the S/N has significantly dropped, in this example by a factor of at least 50. The left column in Fig. 6 shows a waterfall-plot for individual pulses on the same date. This precisely shows the progression from the Q mode to the B mode. This poses a challenge, albeit a tractable one, for timing as one must be careful to account for this moding, i.e. only consider times when the pulsar is in the B mode. This switching behaviour is seen in the wider pulsar sample when observing sensitivity and cadence allow (Lyne et al. 2010). It appears to be due to magnetospheric switching, i.e. the entire pulsar magnetosphere switching from one stable configuration to another (Timokhin 2010). While this is now widely observed (Keane 2013) it remains an open question as to why pulsars switch at all, and why they switch back and forth between stable, possibly quantised, states (Cordes 2013).
This source presents an excellent opportunity to study this phenomenon as it reliably switches in a tractable timescale. It is to be expected that the spin-down rate in each mode is different, as the volume of the magnetosphere and pulsar wind have changed; however, the relative time spent in each mode may not permit the spin-down rate to be measured for this source.
The switch itself is seen here to take less than 1 rotation period. Its light cylinder distance is ∼25 300 km, ∼84 ms light travel time. The dynamical timescale  ms meaning that such large-scale reconfigurations could conceivably occur this rapidly. Detailed full-polarisation single pulse studies at the transitions of this source may be able to pin down the location and scale sizes of the switches.
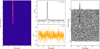 |
Fig. 6 Observation of PSR J0826+2637 on April 18, 2023. Left column: emission as a function of time in 10-second sub-integrations. The transition in emission modes is evident. Middle column: pulse profile during the B mode (top) and Q mode (bottom). Right column: ‘Joy-Division’ plot, displaying rotation period numbers 650 to 800. The transition from the Q mode to the B mode is marked by a sudden increase in pulse brightness. |
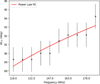 |
Fig. 7 Full width at 10% of the peak flux density (W10) for PSR J2145 −0750 as a function of frequency. Unlike the W50 values shown in Fig. 4, W10 exhibits a clear increasing trend. The red line indicates a power-law fit to the data. |
4.5 PSR J1022+1001
PSR J1022+1001 is another precisely timed pulsar. Due to its exceptional stability and relatively low declination, all PTAs worldwide include this pulsar in their observations, making it one of the most thoroughly studied MSPs of all times. In our analysis, we report a DM of 10.25321 ± 0.00002 pc cm−3 with a median DM uncertainty of 1.6 × 10⁻⁴ pc cm−3. Additionally, we report an rms error on the timing residuals of 54.92 μs. With an ELAT of −0.06°, the LoS of this pulsar passes through the Sun. This proximity enables the examination of SW effects on the pulsar’s signal, as previously investigated by studies such as Tiburzi et al. (2021) and Susarla et al. (2024). In particular, Susarla et al. (2024), who studied a decade’s worth of LOFAR data with a reasonably high cadence, show that this pulsar has consistently higher values of electron density at 1 AU. They attributed this phenomenon to the fact that the LoS of this pulsar crosses through the slow wind region of the SW, which is of higher electron density. They also show the need for a variablemodel of SW for PTA sources like these to mitigate this noise effectively.
4.6 PSR J1136+1551
PSR J1136+1551 (or B1133+16) is an isolated pulsar with a period of 1.18 s, characterised by a double-peaked profile and a high S/N. We report a DM of 4.84821 ± 0.00007 pc cm−3, with an rms timing residual error of 122.38 μs. Previous studies have documented the occurrence of unusually intense single pulses, known as giant pulses (Kazantsev & Potapov 2015), which provide an opportunity to explore the pulsar’s emission mechanisms in greater depth (Oswald et al. 2019).
4.7 PSR J1300+1240 (B1257+12)
PSR J1300+1240 was the first pulsar found to host a planetary system, with three planets detected in orbit around it (Wolszczan & Frail 1992). This discovery was also the earliest evidence of extrasolar planets. Located approximately 710 pc from the Sun, the J1300+1240 system is thought to have originated from a white dwarf merger. The presence of orbiting planets necessitates a complex timing model to account for the influences of all planetary bodies. We report a DM of 10.1588 ± 0.0028 pc cm−3, with an rms timing residual error of 30.43 μs. Notably, the DM of this pulsar varies over extended timescales, indicating turbulence in the local ISM. Due to its low ELAT, effects of the SW are seen in I-LOFAR data, particularly during the first solar conjunction near MJD 59900, as shown in Fig. 3.
4.8 PSRJ1645-0317
PSR J1645-0317 is a bright pulsar in the LOFAR band with a period of ∼387 ms. It has large DM variations with a considerable change of 0.002 pc cm−3 over a period of two years (see Fig. 3). We report a DM of 35.7416 ± 0.0022 pc cm−3 and an rms timing residual error of 57.36 μs.
Given the strong DM variations observed in this pulsar, we investigated the potential frequency dependence of DM (Cordes et al. 2016). To this end, we constructed a standard template comprising 20 frequency channels using the methodology described in Sect. 3.1 and divided that into two templates of 10 frequency channels each. The observations were frequency-averaged into 20 channels and subsequently divided into two sub-bands, each consisting of 10 channels, with central frequencies of approximately 130 MHz for the lower sub-band and 170 MHz for the upper sub-band. Following the approach outlined in Sect. 4.1, we generated DM time series for both sub-bands using their respective templates. The resulting DM time series, shown in Fig. 8, exhibit systematic differences between DMs measured at the same epoch but in different frequency bands, providing tentative evidence for DM chromaticity. This effect has been previously reported for PSR J2219+4754 (Donner et al. 2019) and is primarily attributed to small-scale, high-amplitude variations in the interstellar electron density. As discussed by Cordes et al. (2016), such variations arise from turbulence in the IISM, which induces frequency-dependent multi-path propagation due to the resulting microstructure. While such chromatic DM variations could pose challenges for high-precision pulsar timing experiments, the long-term trends in the two sub-bands appear to be consistent with one another. Consequently, the impact on timing precision may be negligible.
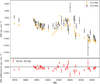 |
Fig. 8 DM chromaticity in PSR J1645-0317. Top panel: DM time series at 170.6 MHz (black points with error bars) and 131.5 MHz (orange points). Bottom panel: difference in the absolute values of their DMs at the same epoch. It is worth noting that the DM trends in the two bands are different, highlighting the frequency-dependent DMs. |
4.9 PSRJ2145-0750
PSR J2145-0750 is a bright pulsar with a period of 16 ms. We report a DM of 9.00272 ± 0.00001 pc cm−3 and an rms timing residual error of 28.60 μs. With an ELAT of ∼5°, it is an ideal probe to study the effects of SW. Due to its relatively stable timing solution (Verbiest et al. 2009), PSR J2145-0750 is also monitored as a PTA pulsar. Its low declination allows observation by every major PTA, providing a wealth of data for precision timing projects.
5 Conclusions
This study presents long-term timing results of seven ecliptic pulsars observed with I-LOFAR over a two to three year period, focusing on the effects of dispersion due to the IISM and the SW. A significant outcome of this research are precise DM measurements determined using pulsar timing. The DM time series of four pulsars exhibit clear variations correlated with their ELATs, highlighting the impact of the SW. We observe that a spherically symmetric electron density model of the SW is not able to completely model the variability that can be seen in Fig. 5 for pulsars such as PSR J1022+1001. The precise DMs obtained in this study emphasise the role of low-frequency observations in complementing higher-frequency PTA datasets (which have much poorer DM precision), particularly in mitigating DM noise and SW noise. In GW studies, these noise sources act as foregrounds (Verbiest & Shaifullah 2018). The precision is also at the point that it may be possible to detect variation in the ionospheric DM using only pulsar timing. The LOFAR DM precision is ∼30 TECU, and other instruments coming online under more active regions of the ionosphere should have better resolution still.
This study also examined the frequency evolution of pulse profiles, shedding light on pulsar emission geometries. While most pulsars seem to follow a consistent decrease in W50 with increasing frequency, deviations from this expected behaviour were observed. Separately, we examined the pulse-nulling phenomenon in PSR J0826+2637. This pulsar shows extreme weakness in its Q mode, with a sudden switch to the B mode occurring within a single rotation. Such rapid mode transitions are likely magnetospheric in origin, suggesting quantised stable magnetospheric states, and we see that the switching process occurs in less than one rotation period.
Furthermore, we investigated the DM chromaticity of PSR J1645-0317. Our findings present tentative evidence of frequency-dependent dispersion effects in this source. To robustly confirm this phenomenon, dedicated observations with exceptionally high fractional bandwidths and sensitivities at low frequencies are essential. This could come from a combined campaign using, for example, LOFAR and the Giant Metre wave Radio Telescope, but SKA1-Low’s advanced capabilities are probably best suited for such studies, promising significantly improved DM precision. By utilising bright pulsars like PSR J1645-0317, even during commissioning, SKA1- Low (Braun et al. 2019) can serve as a critical tool for testing these effects, ultimately enabling more accurate pulsar timing and deepening our understanding of interstellar propagation.
Data availability
All the data presented are publicly available on Zenodo (Susarla 2025)7. This repository includes down-sampled archives, timing solutions, ToAs, templates, and DM time series. Additional data can be provided upon request.
Acknowledgements
SCS acknowledges the support of a University of Galway, College of Science and Engineering fellowship in supporting this work. O.A.J. acknowledges the support of Breakthrough Listen which is managed by the Breakthrough Prize Foundation. J.P.W.V. acknowledges support from the National Science Foundation (NSF) AccelNet program, award no. 2114721. The authors thank Letizia Vincetti for her valuable comments on the paper. The Rosse Observatory is operated by Trinity College Dublin. I-LOFAR infrastructure has benefited from funding from Science Foundation Ireland, a predecessor of Taighde Éireann – Research Ireland.
References
- Agazie, G., Archibald, A. M., Arzoumanian, Z., et al. 2023, ApJ, 951, L8 [NASA ADS] [CrossRef] [Google Scholar]
- Agazie, G., Anumarlapudi, A., Archibald, A. M., et al. 2024, ApJ, 966, 105 [NASA ADS] [CrossRef] [Google Scholar]
- Antoniadis, J., Arumugam, S., Babak, S., et al. 2023a, A&A, 678, A50 [CrossRef] [EDP Sciences] [Google Scholar]
- Antoniadis, J., Bak Nielsen, A.-S., Bassa, C. G., et al. 2023b, A&A, 678, A48 [Google Scholar]
- Backer, D. C., Heiles, C., Davis, M. M., et al. 1982, Nature, 300, 615 [NASA ADS] [CrossRef] [Google Scholar]
- Bailes, M., Lorimer, D. R., Johnston, S., et al. 1994, ApJ, 425, L41 [NASA ADS] [CrossRef] [Google Scholar]
- Bartel, N. 1981, A&A, 97, 384 [NASA ADS] [Google Scholar]
- Braun, R., Bourke, T., Keane, E., et al. 2019, arXiv e-prints [arXiv:1912.12699] [Google Scholar]
- Bray, J., Roberts, P., Reynolds, J., et al. 2015, Astropart. Phys., 65, 22 [NASA ADS] [CrossRef] [Google Scholar]
- Contopoulos, I., Kazanas, D., & Fendt, C. 1999, ApJ, 511, 351 [Google Scholar]
- Cordes, J. M. 2013, ApJ, 775, 47 [NASA ADS] [CrossRef] [Google Scholar]
- Cordes, J. M., Shannon, R. M., & Stinebring, D. R. 2016, ApJ, 817, 16 [Google Scholar]
- Craft, H. D., Lovelace, R. V. E., & Sutton, J. M. 1968, IAU Circ., 2100, 1 [Google Scholar]
- Donner, J. Y., Tiburzi, C., Osłowski, S., et al. 2019, A&A, 624, A22 [NASA ADS] [CrossRef] [EDP Sciences] [Google Scholar]
- Donner, Tiburzi, C., Osłowski, S., et al. 2020, A&A, 644, A153 [NASA ADS] [CrossRef] [EDP Sciences] [Google Scholar]
- Edwards, R. T., Hobbs, G. B., & Manchester, R. N. 2006, MNRAS, 372, 1549 [Google Scholar]
- Gold, T. 1968, Nature, 218, 731 [NASA ADS] [CrossRef] [Google Scholar]
- Hamaker, J. P., Bregman, J. D., & Sault, R. J. 1996, A&AS, 117, 137 [NASA ADS] [CrossRef] [EDP Sciences] [Google Scholar]
- Hankins, T. H., & Rickett, B. J. 1975, Methods Computat. Phys., 14, 55 [Google Scholar]
- Hankins, T. H., & Rankin, J. M. 2010, AJ, 139, 168 [NASA ADS] [CrossRef] [Google Scholar]
- Hassall, T. E., Weltevrede, P., Hessels, J. W. T., et al. 2013, A&A, 552, A61 [NASA ADS] [CrossRef] [EDP Sciences] [Google Scholar]
- Helfand, D. J., Manchester, R. N., & Taylor, J. H. 1975, ApJ, 198, 661 [Google Scholar]
- Hellings, R. W., & Downs, G. S. 1983, ApJ, 265, L39 [NASA ADS] [CrossRef] [Google Scholar]
- Hobbs, G. B., Edwards, R. T., & Manchester, R. N. 2006, MNRAS, 369, 655 [Google Scholar]
- Hotan, A. W., van Straten, W., & Manchester, R. N. 2004, PASA, 21, 302 [Google Scholar]
- Iraci, F., Tiburzi, C., Verbiest, J. P. W. 2024, A&A, 692, A170 [NASA ADS] [CrossRef] [EDP Sciences] [Google Scholar]
- Jones, R. C. 1941, J. Opt. Soc. Am., 31, 488 [Google Scholar]
- Kazantsev, N. A., & Potapov, V. A. 2015, Astron. Tsirk., 1628, 1 [Google Scholar]
- Keane, E. F. 2013, in IAU Symposium, 291, Neutron Stars and Pulsars: Challenges and Opportunities after 80 years, ed. J. van Leeuwen, 295 [Google Scholar]
- Kriegel, M., & Berdermann, J. 2020, in 2020 European Navigation Conference (ENC), 1 [Google Scholar]
- Lazarus, P., Graikou, E., Caballero, R. N., et al. 2016, MNRAS, 458, 868 [NASA ADS] [CrossRef] [Google Scholar]
- Liu, K., Lee, K. J., Kramer, M., et al. 2012, MNRAS, 420, 361 [NASA ADS] [CrossRef] [Google Scholar]
- LOFAR Collaboration 2023, LOFAR2.0 White Paper v2023.1, accessed: 202412-02 [Google Scholar]
- Lorimer, D. R. 2011, SIGPROC: Pulsar Signal Processing Programs, Astrophysics Source Code Library [record ascl:1107.016] [Google Scholar]
- Lorimer, D. R., & Kramer, M. 2004, Handbook of Pulsar Astronomy (Cambridge University Press) [Google Scholar]
- Lyne, A. G., & Manchester, R. N. 1988, MNRAS, 234, 477 [NASA ADS] [CrossRef] [Google Scholar]
- Lyne, A., Kramer, M., Stairs, I., et al. 2010, Science, 329, 408 [NASA ADS] [CrossRef] [Google Scholar]
- McKenna, D. J., Keane, E. F., Gallagher, P. T., & McCauley, J. 2024, J. Open Source Software, 9, 5517 [Google Scholar]
- Michel, F. C., & Li, H. 1999, Phys. Rep., 318, 227 [NASA ADS] [CrossRef] [Google Scholar]
- Mitra, D., & Deshpande, A. A. 1999, A&A, 346, 906 [NASA ADS] [Google Scholar]
- Murphy, P. C., McCauley, J., McKenna, D. J., et al. 2021, A&A, 655, A16 [NASA ADS] [CrossRef] [EDP Sciences] [Google Scholar]
- Oswald, L., Karastergiou, A., & Johnston, S. 2019, MNRAS, 489, 310 [NASA ADS] [CrossRef] [Google Scholar]
- Perera, B. B. P., Demorest, P. B., Kerr, M., et al. 2019, MNRAS, 490, 4666 [NASA ADS] [CrossRef] [Google Scholar]
- Philippov, A. A., Spitkovsky, A., & Cerutti, B. 2015, ApJ, 801, L19 [NASA ADS] [CrossRef] [Google Scholar]
- Rankin, J. M. 1983a, ApJ, 274, 333 [NASA ADS] [CrossRef] [Google Scholar]
- Rankin, J. M. 1983b, ApJ, 274, 359 [Google Scholar]
- Rankin, J. M., Olszanski, T. E. E., & Wright, G. A. E. 2020, ApJ, 890, 151 [NASA ADS] [CrossRef] [Google Scholar]
- Reardon, D. J., Shannon, R. M., Hobbs, G. B., et al. 2023, ApJ, 951, L6 [NASA ADS] [CrossRef] [Google Scholar]
- Ruderman, M. A., & Sutherland, P. G. 1975, ApJ, 196, 51 [Google Scholar]
- Sobey, C., Hessels, J. W. T., Weltevrede, P., et al. 2015, MNRAS, 451, 2493 [Google Scholar]
- Stairs, I. H. 2003, Liv. Rev. Relativ., 6, 5 [Google Scholar]
- Susarla, S. C. 2025, Irish-Low Frequency Array (IE613) observatory ecliptic pulsar data release [Google Scholar]
- Susarla, S. C., Tiburzi, C., Keane, E. F., et al. 2024, A&A, 692, A18 [NASA ADS] [CrossRef] [EDP Sciences] [Google Scholar]
- Taylor, J. H. 1992, Philos. Trans. Roy. Soc. Lond. Ser. A, 341, 117 [Google Scholar]
- Tiburzi, C., Shaifullah, G. M., Janssen, G. H., et al., 2019, MNRAS, 487, 394 [NASA ADS] [CrossRef] [Google Scholar]
- Tiburzi, C., Bassa, C. G., Zucca, P., et al. 2021, A&A, 647, A84 [NASA ADS] [CrossRef] [EDP Sciences] [Google Scholar]
- Timokhin, A. N. 2010, MNRAS, 408, L41 [NASA ADS] [CrossRef] [Google Scholar]
- van Haarlem, M. P., Gunst, A. W., Heald, G., et al. 2013, A&A, 556, A2 [NASA ADS] [CrossRef] [EDP Sciences] [Google Scholar]
- van Straten, W., & Bailes, M. 2011, PASA, 28, 1 [Google Scholar]
- van Straten, W., Demorest, P., & Oslowski, S. 2012, Astron. Res. Technol., 9, 237 [NASA ADS] [Google Scholar]
- Verbiest, J. P. W., & Shaifullah, G. M. 2018, Class. Quant. Grav., 35, 133001 [NASA ADS] [CrossRef] [Google Scholar]
- Verbiest, J. P. W., Coles, W. A., Hobbs, G. B., et al. 2009, MNRAS, 400, 951 [Google Scholar]
- Verbiest, J. P. W., Hobbs, G., van Haasteren, R., et al. 2016, MNRAS, 458, 1267 [Google Scholar]
- Verbiest, J. P. W., Porayko, N. K., Chen, S., et al. 2024, Results Phys., 61, 107719 [Google Scholar]
- Wolszczan, A., & Frail, D. 1992, Nature, 355, 145 [CrossRef] [Google Scholar]
- Xu, X., Zhi, Q. J., Qiao, G. J., et al. 2021, ApJ, 917, 108 [Google Scholar]
- Xu, H., Guo, Y., Jiang, J., et al. 2023, Res. Astron. Astrophys., 23, 075024 [CrossRef] [Google Scholar]
All Tables
All Figures
|
Fig. 1 Aitoff projection of the locations of the pulsars listed in Table 1. The pulsars are shown as star symbols and the ecliptic plane with a yellow dashed line. |
| In the text | |
|
Fig. 2 Frequency evolution of normalised pulse profiles. Darker shades correspond to a high frequency and vice versa. |
| In the text | |
|
Fig. 3 DM time series of each pulsar. The red points in each panel are the epochs that are less than 45 degrees from the Sun. |
| In the text | |
|
Fig. 4 FWHM pulse widths for the pulsars in our dataset. The black stars represent the pulse width at each frequency, with the corresponding error in measurement. The red lines in each panel are the power-law fits on the FWHM values. The FWHM values that lie below the power-law fits correspond to the absorption features, which can be seen most prominently in PSRs J1300+1240 and J1645-0317 |
| In the text | |
|
Fig. 5 Residuals after timing using tempo2. The different colours are representative of different frequencies. |
| In the text | |
|
Fig. 6 Observation of PSR J0826+2637 on April 18, 2023. Left column: emission as a function of time in 10-second sub-integrations. The transition in emission modes is evident. Middle column: pulse profile during the B mode (top) and Q mode (bottom). Right column: ‘Joy-Division’ plot, displaying rotation period numbers 650 to 800. The transition from the Q mode to the B mode is marked by a sudden increase in pulse brightness. |
| In the text | |
|
Fig. 7 Full width at 10% of the peak flux density (W10) for PSR J2145 −0750 as a function of frequency. Unlike the W50 values shown in Fig. 4, W10 exhibits a clear increasing trend. The red line indicates a power-law fit to the data. |
| In the text | |
|
Fig. 8 DM chromaticity in PSR J1645-0317. Top panel: DM time series at 170.6 MHz (black points with error bars) and 131.5 MHz (orange points). Bottom panel: difference in the absolute values of their DMs at the same epoch. It is worth noting that the DM trends in the two bands are different, highlighting the frequency-dependent DMs. |
| In the text | |
Current usage metrics show cumulative count of Article Views (full-text article views including HTML views, PDF and ePub downloads, according to the available data) and Abstracts Views on Vision4Press platform.
Data correspond to usage on the plateform after 2015. The current usage metrics is available 48-96 hours after online publication and is updated daily on week days.
Initial download of the metrics may take a while.