Fig. 6
Download original image
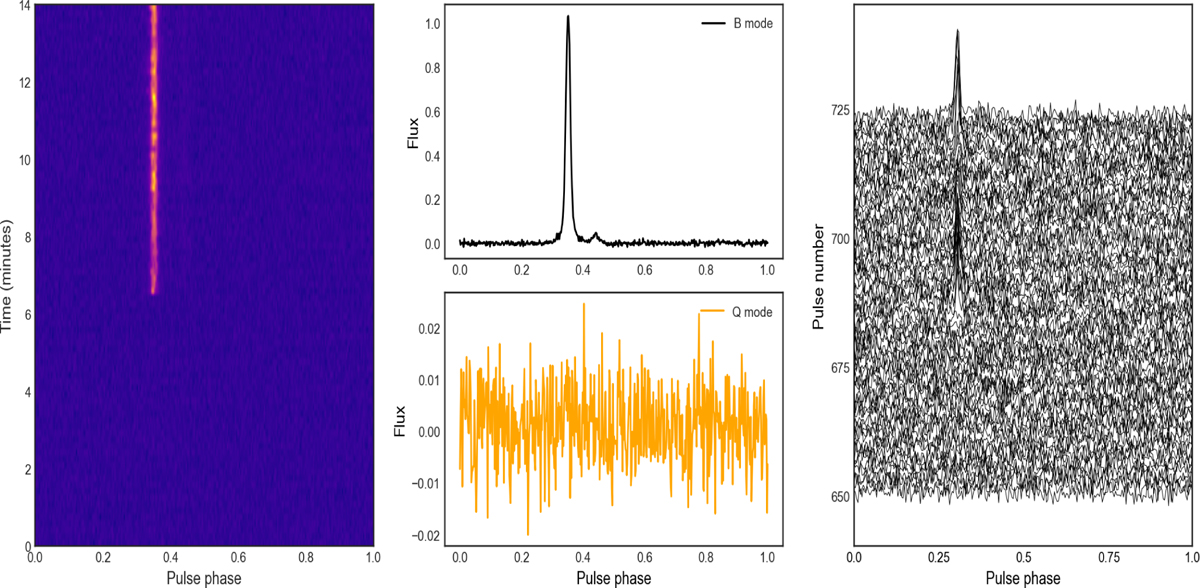
Observation of PSR J0826+2637 on April 18, 2023. Left column: emission as a function of time in 10-second sub-integrations. The transition in emission modes is evident. Middle column: pulse profile during the B mode (top) and Q mode (bottom). Right column: ‘Joy-Division’ plot, displaying rotation period numbers 650 to 800. The transition from the Q mode to the B mode is marked by a sudden increase in pulse brightness.
Current usage metrics show cumulative count of Article Views (full-text article views including HTML views, PDF and ePub downloads, according to the available data) and Abstracts Views on Vision4Press platform.
Data correspond to usage on the plateform after 2015. The current usage metrics is available 48-96 hours after online publication and is updated daily on week days.
Initial download of the metrics may take a while.