Open Access
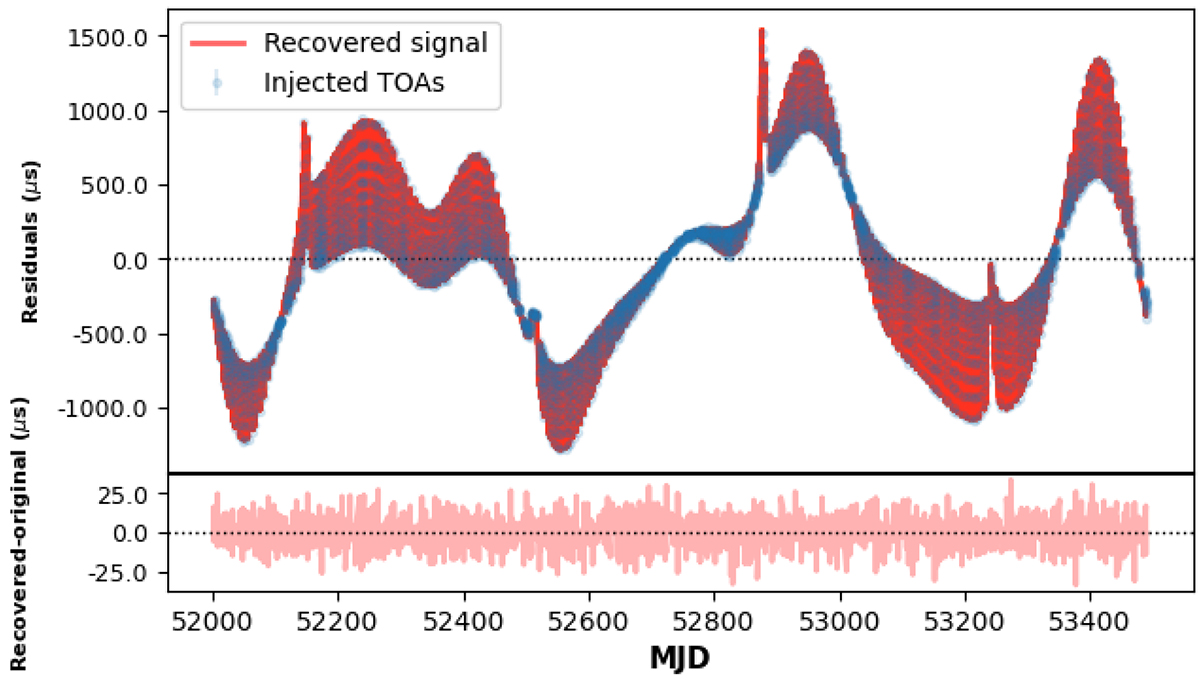
Fig. 4.
Download original image
Time domain reconstruction of the inserted simulations with various noise parameters embedded into it. It presents the specified noise parameters as in Table 2 along with the SW signal. The blue points are the simulated residuals and the orange lines are the recovery after the noise analysis.
Current usage metrics show cumulative count of Article Views (full-text article views including HTML views, PDF and ePub downloads, according to the available data) and Abstracts Views on Vision4Press platform.
Data correspond to usage on the plateform after 2015. The current usage metrics is available 48-96 hours after online publication and is updated daily on week days.
Initial download of the metrics may take a while.