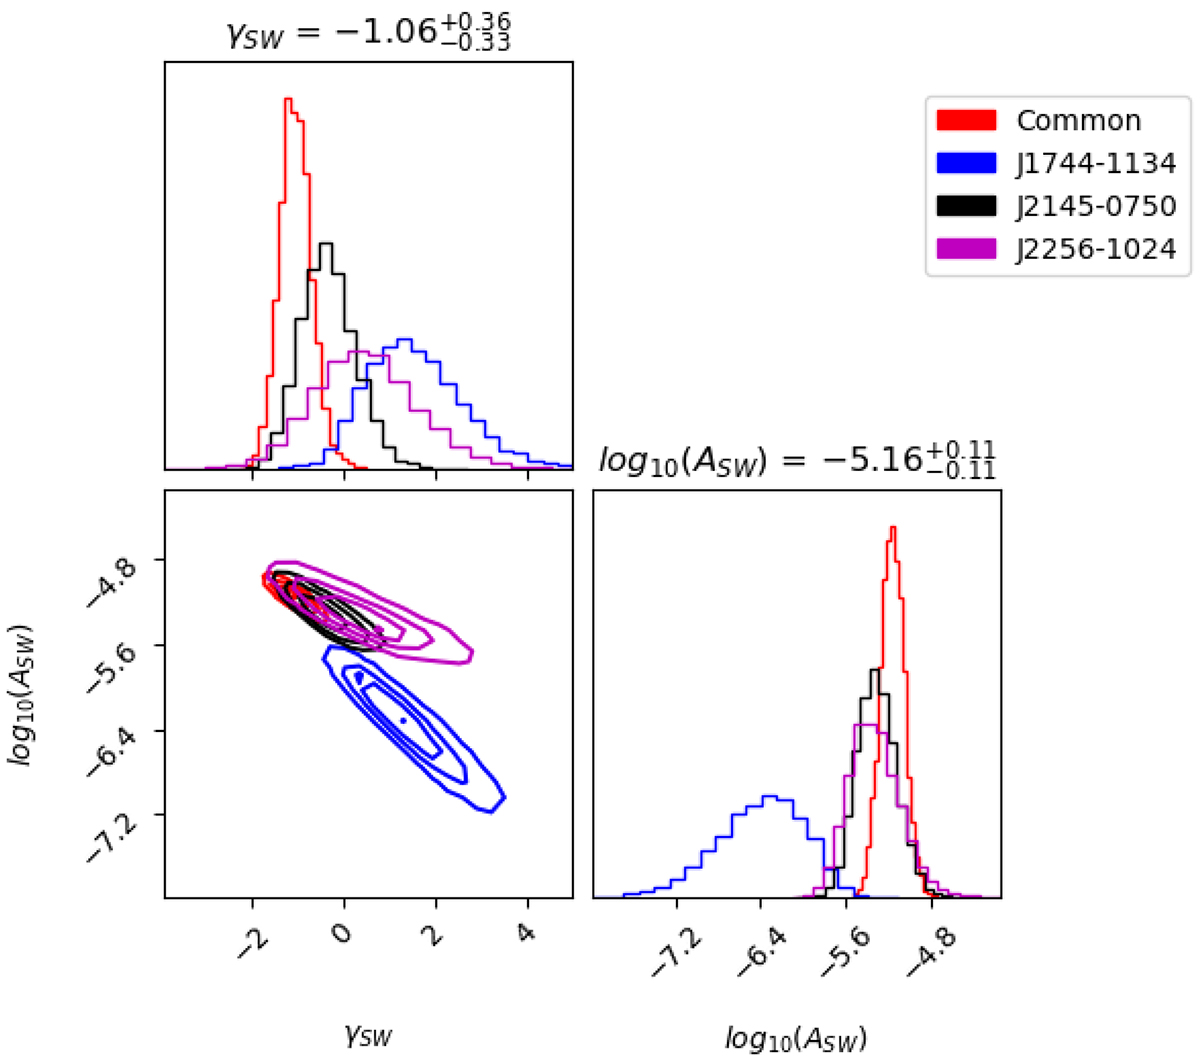
Fig. 20.
Download original image
Posterior distributions for the spectral parameters from the SWGP analysis, modelling time variability as a common signal (red) between all pulsars beyond three degrees from the ecliptic plane, or separately for each pulsar individually (blue, black, purple). The titles shown depict the median values for the common noise part corresponding to red histogram.
Current usage metrics show cumulative count of Article Views (full-text article views including HTML views, PDF and ePub downloads, according to the available data) and Abstracts Views on Vision4Press platform.
Data correspond to usage on the plateform after 2015. The current usage metrics is available 48-96 hours after online publication and is updated daily on week days.
Initial download of the metrics may take a while.