Fig. 2.
Download original image
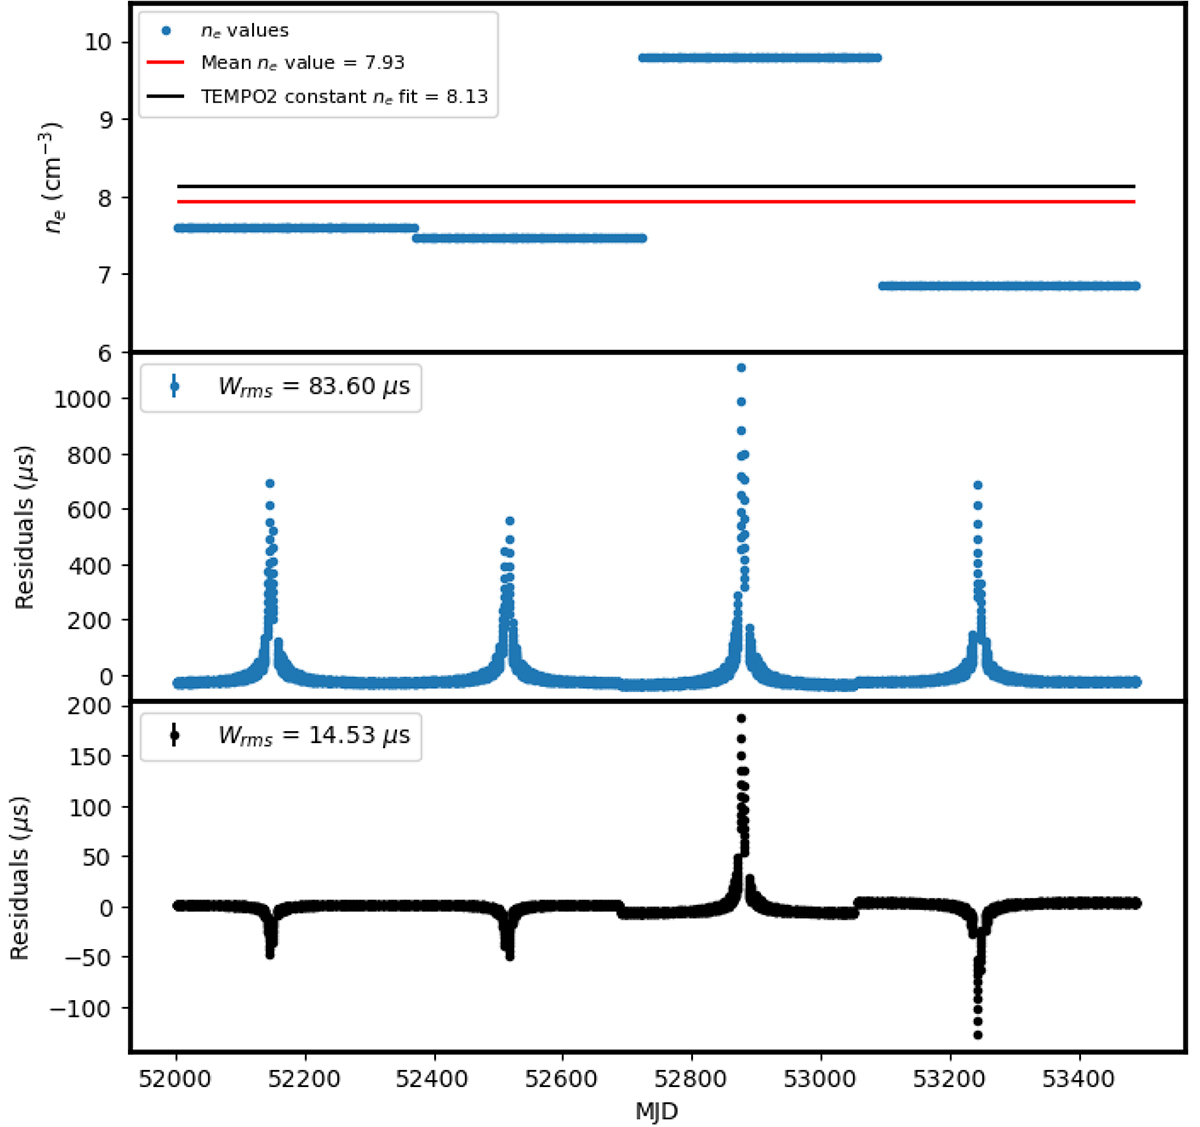
Simulation scenario 1, only SW. Top: ne variations simulated (blue) are shown as well as the mean value (red) and the ne retrieved (green) when fit for a single value with TEMPO2. Middle: Blue points represent the residuals corresponding to the injected values of ne. Bottom: Green points represent the residuals after a constant ![]() fit in TEMPO2.
fit in TEMPO2.
Current usage metrics show cumulative count of Article Views (full-text article views including HTML views, PDF and ePub downloads, according to the available data) and Abstracts Views on Vision4Press platform.
Data correspond to usage on the plateform after 2015. The current usage metrics is available 48-96 hours after online publication and is updated daily on week days.
Initial download of the metrics may take a while.