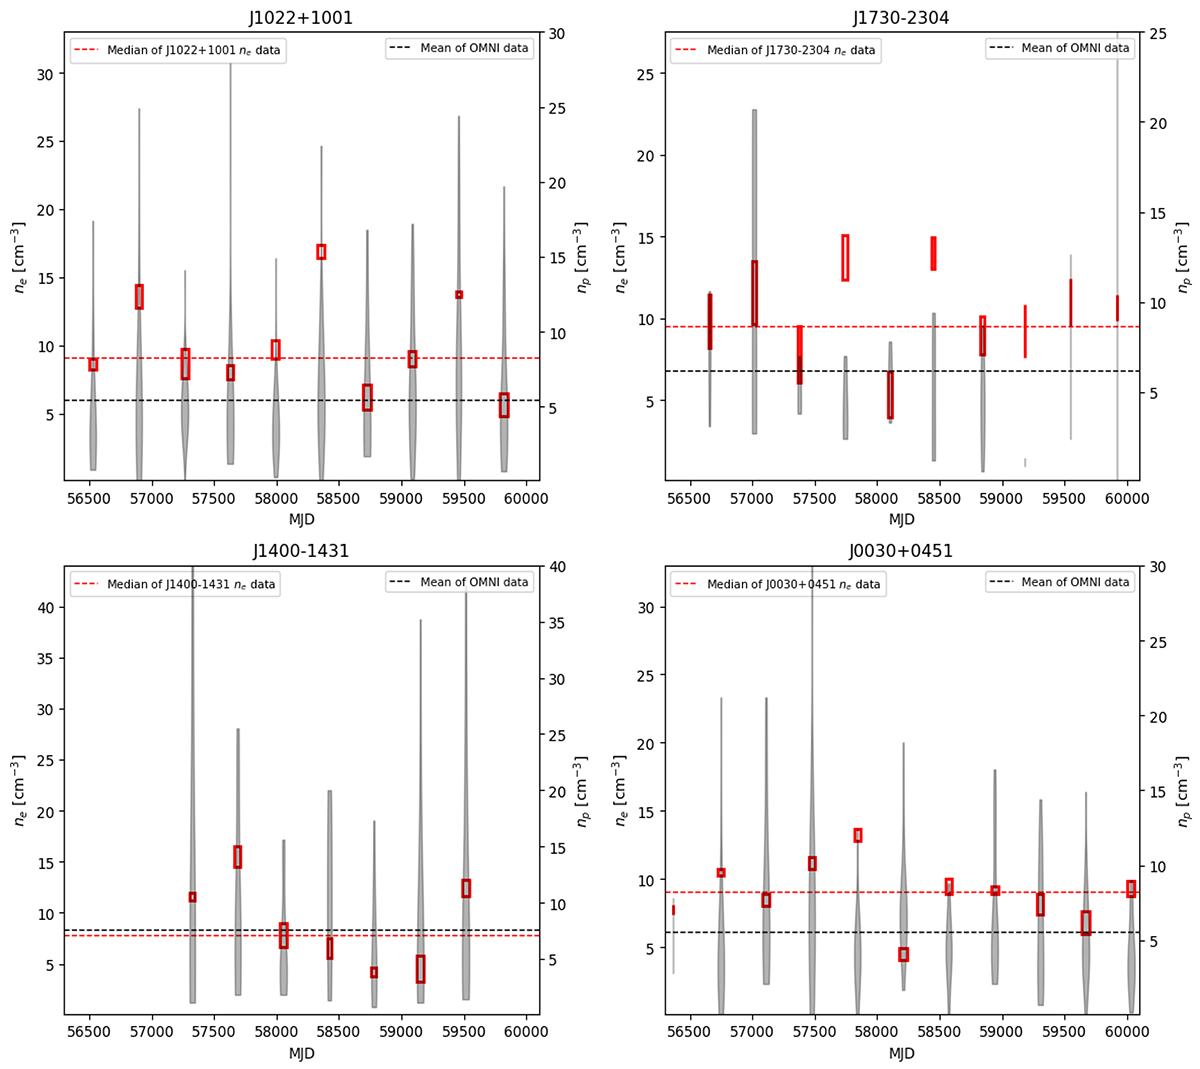
Fig. 16.
Download original image
Comparison with in situ Observations: The Fig. shows the variations of ne derived from pulsar observations (red boxes) using the models described in this paper. Only observations where the angular separation between the pulsar and the Sun is less than 30 degrees, as seen from Earth, are included. The red horizontal line represents the median of the pulsar-derived electron density values. The black violin plots indicate the variations in proton density (nP) from the OMNI data, measured within a ±2 hour window around each pulsar observation. The horizontal black dashed line denotes the mean proton density from the OMNI data corresponding to the pulsar observation times. Since the space probes measure proton densities and the pulsars measure electron densities, direct comparison between the two is non-trivial. The four panels represent different pulsars: J1022+1001, J1730-2304, J1400-1431, and J0030+0451, each showing unique density variations over time.
Current usage metrics show cumulative count of Article Views (full-text article views including HTML views, PDF and ePub downloads, according to the available data) and Abstracts Views on Vision4Press platform.
Data correspond to usage on the plateform after 2015. The current usage metrics is available 48-96 hours after online publication and is updated daily on week days.
Initial download of the metrics may take a while.