Fig. 1.
Download original image
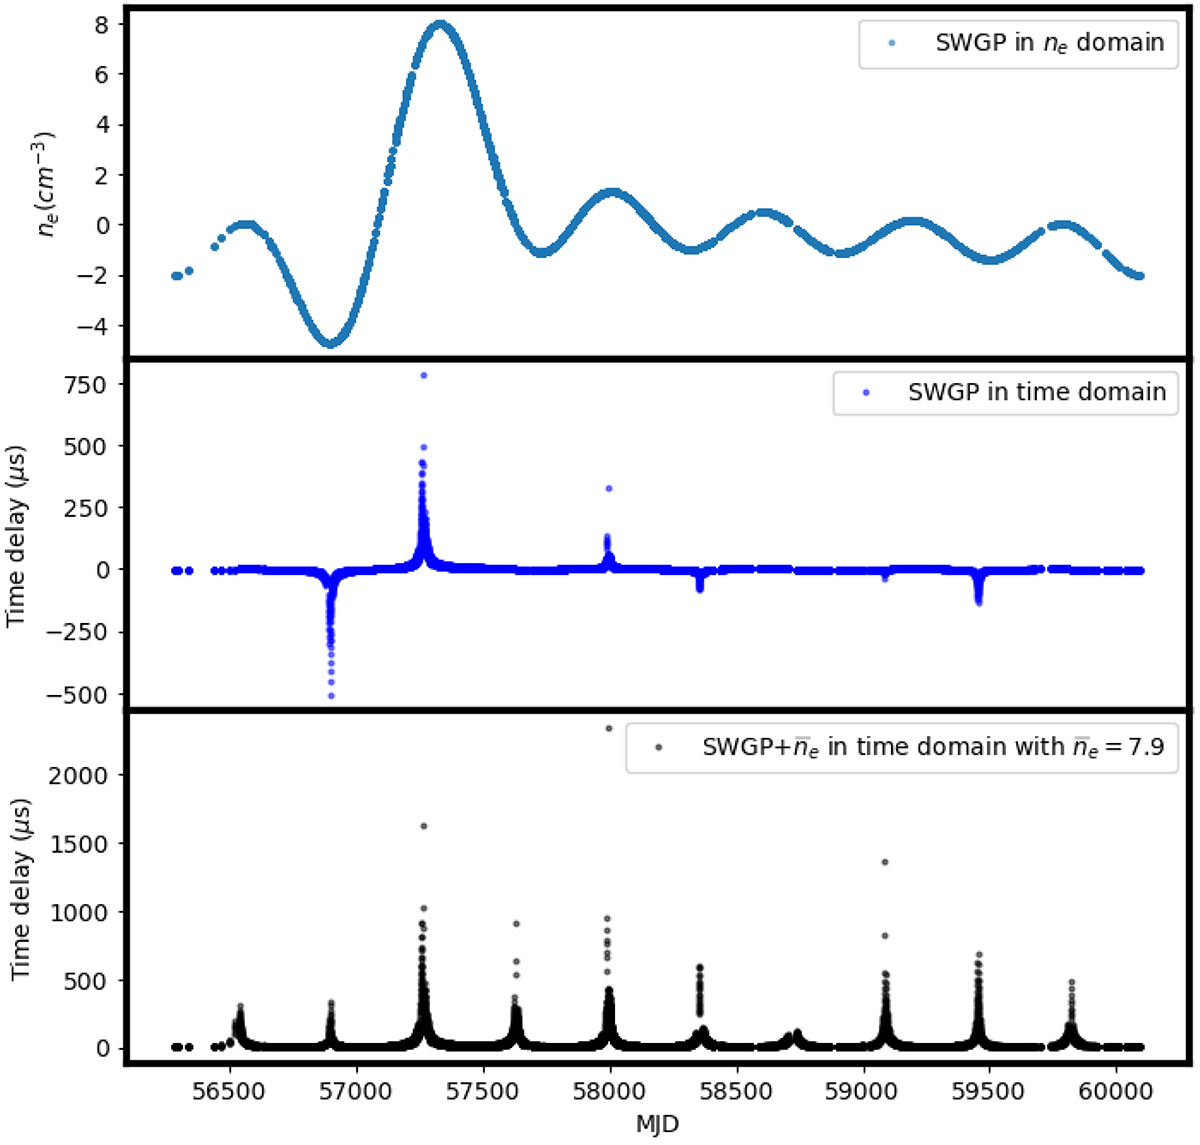
Sample results from one SWGP realisation. In a hypothetical scenario, considering the long time span of one of the pulsars in our dataset PSR J1022+1001. The top panel shows the variations in ne that can be modelled using SWGP perturbed from the mean value. The middle panel shows the corresponding time delays due to SWGP. The bottom panel shows the time delay when the deterministic signal with an ![]() of 7.9 is added on top of SWGP.
of 7.9 is added on top of SWGP.
Current usage metrics show cumulative count of Article Views (full-text article views including HTML views, PDF and ePub downloads, according to the available data) and Abstracts Views on Vision4Press platform.
Data correspond to usage on the plateform after 2015. The current usage metrics is available 48-96 hours after online publication and is updated daily on week days.
Initial download of the metrics may take a while.