Open Access
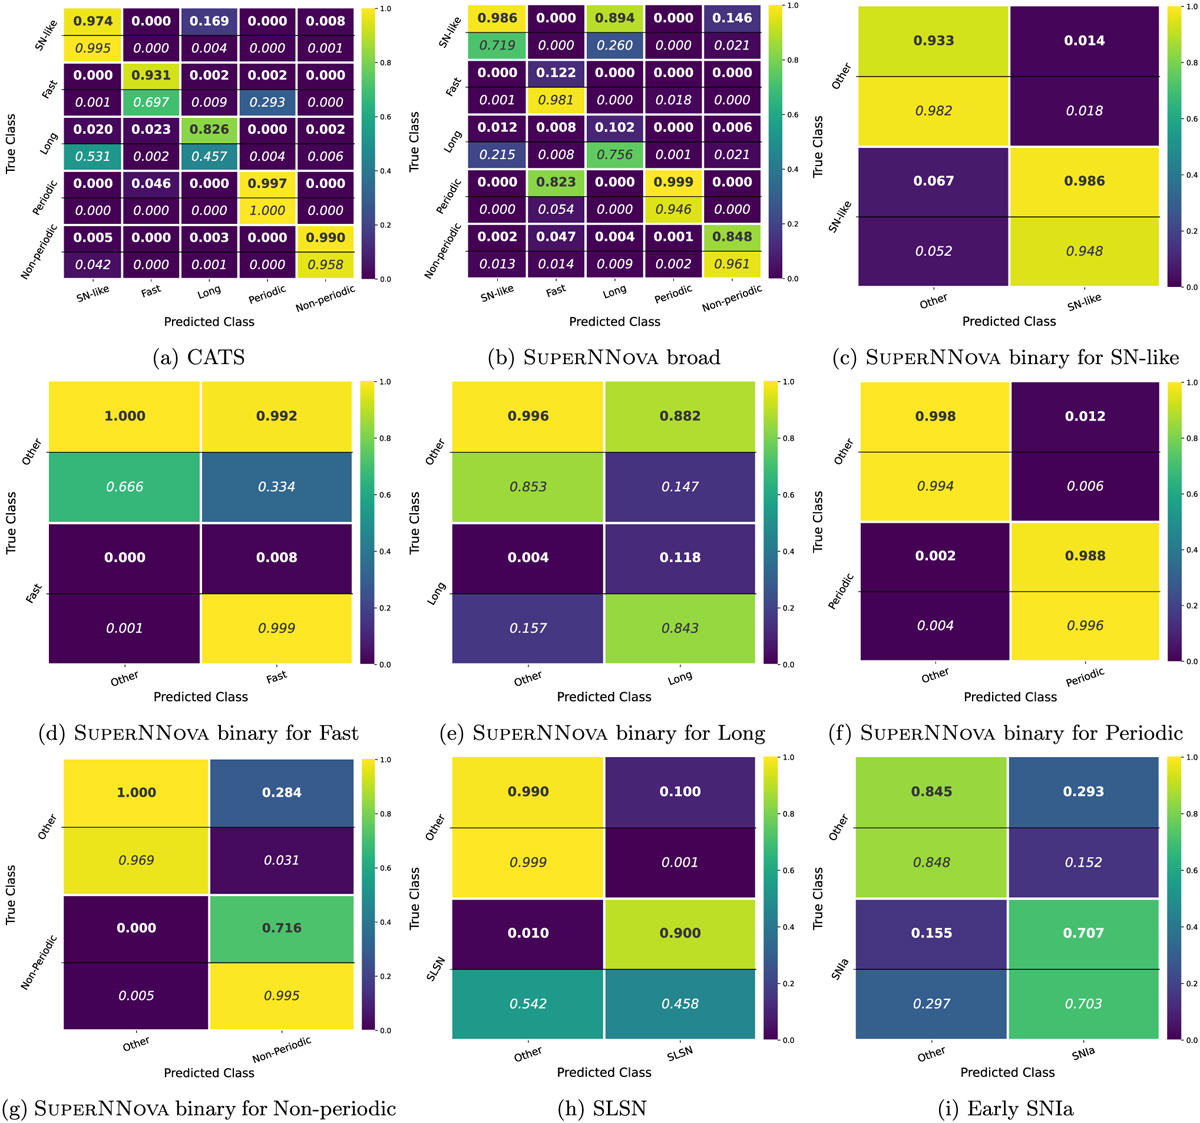
Fig. 8
Download original image
Confusion matrices for each classifier in the test test. For each cell in the confusion matrix, the top row (in bold) was normalised to the predictions and the bottom row (in italics) to the true values so that the main diagonal shows the precision in bold, on top, and recall in italics, at the bottom.
Current usage metrics show cumulative count of Article Views (full-text article views including HTML views, PDF and ePub downloads, according to the available data) and Abstracts Views on Vision4Press platform.
Data correspond to usage on the plateform after 2015. The current usage metrics is available 48-96 hours after online publication and is updated daily on week days.
Initial download of the metrics may take a while.