Open Access
Fig. 4
Download original image
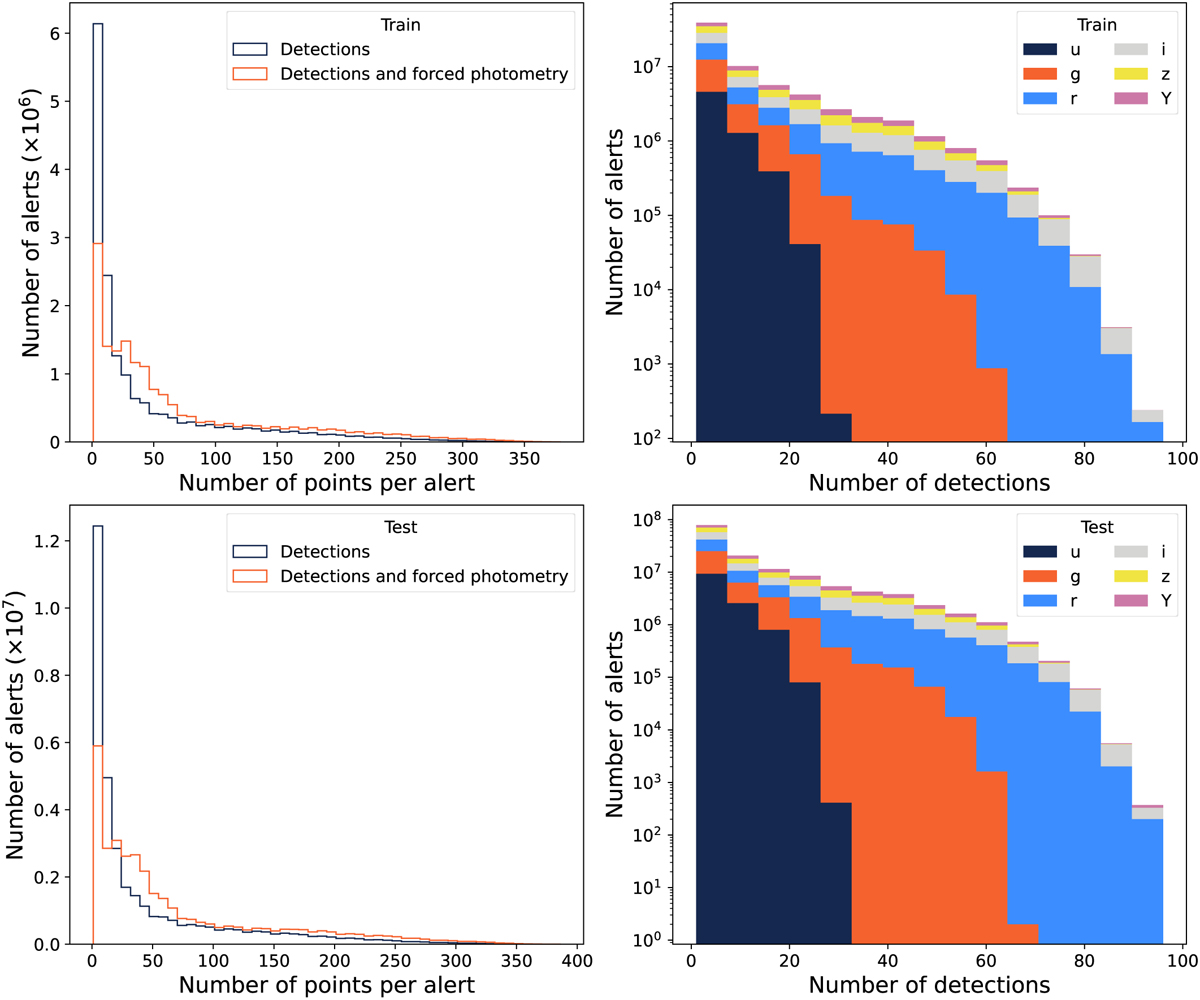
Distribution of light curve length in the training (top) and test (bottom) samples. On the left, the total number of points including only detections (blue) and with forced photometry (orange). On the right, the distribution of detections per filter.
Current usage metrics show cumulative count of Article Views (full-text article views including HTML views, PDF and ePub downloads, according to the available data) and Abstracts Views on Vision4Press platform.
Data correspond to usage on the plateform after 2015. The current usage metrics is available 48-96 hours after online publication and is updated daily on week days.
Initial download of the metrics may take a while.