Fig. 3.
Download original image
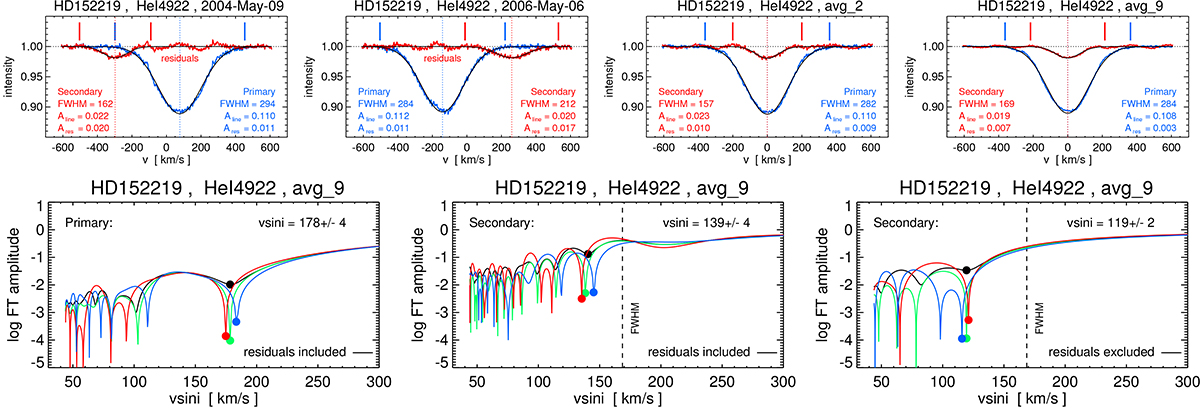
One of the worst cases (DT 5) of the effects of disentangling residuals of HD 152219 in He I 4922. Top, two left panels: Single spectra as observed on 2004 May 09 and on 2006 May 06. The two right panels show the average of the two spectra and of all nine spectra used, whereby each component has been shifted to RV = 0 before averaging. The black lines mark Gaussian fits to the profiles, with FWHM and height Aline labelled. Likewise, the peak-to-peak amplitude of the residual wiggles, Ares, is given, determined outside of the velocity range ±3σ of each profile marked by the coloured vertical bars. Averaging reduces the residual wiggles. Bottom: Fourier transform amplitude of the average of all nine spectra, for the primary (left panel), and for the secondary including and excluding residuals (middle and right panel, respectively). The details are explained in Sect. 3.2.3.
Current usage metrics show cumulative count of Article Views (full-text article views including HTML views, PDF and ePub downloads, according to the available data) and Abstracts Views on Vision4Press platform.
Data correspond to usage on the plateform after 2015. The current usage metrics is available 48-96 hours after online publication and is updated daily on week days.
Initial download of the metrics may take a while.