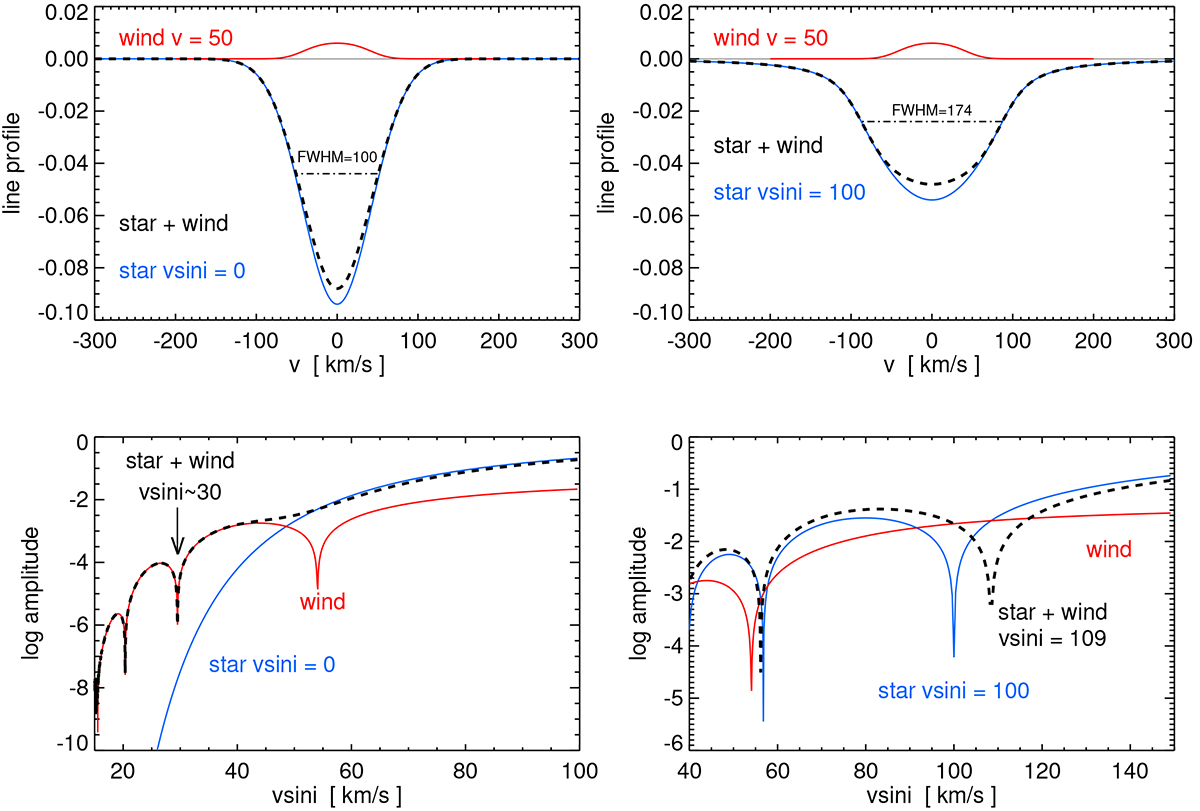
Fig. B.1.
Download original image
Effect of the emission of an isotropic slow wind on the line profile (top) and its Fourier transform (FT, bottom), for two rotation speeds v sin i = 0 km/s (“null rotator” left) and v sin i = 100 km/s (“mid rotator” right). Top: The blue solid line shows (1) the rotating star, a rotationally broadened line profile convolved with Lorentzian, vrot = 50 km/s, FWHM vturb = 50 km/s. The red solid line shows (2) an isotropic slow wind halo with vwind = 50 km/s and dispersion ≈ 20 km/s (total FWHM ≈ 65 km/s). The wind strength is 5% of the stellar equivalent width. The dash-dotted black line shows the combined profile of star and wind (sum of (1) and (2)). We note that the combined profile has a rounder (i.e. more boxy) shape than the pure stellar profile. Bottom: FT amplitude of the rotating star (blue), of the wind halo (red), and of the combined profile (star and wind, black).
Current usage metrics show cumulative count of Article Views (full-text article views including HTML views, PDF and ePub downloads, according to the available data) and Abstracts Views on Vision4Press platform.
Data correspond to usage on the plateform after 2015. The current usage metrics is available 48-96 hours after online publication and is updated daily on week days.
Initial download of the metrics may take a while.