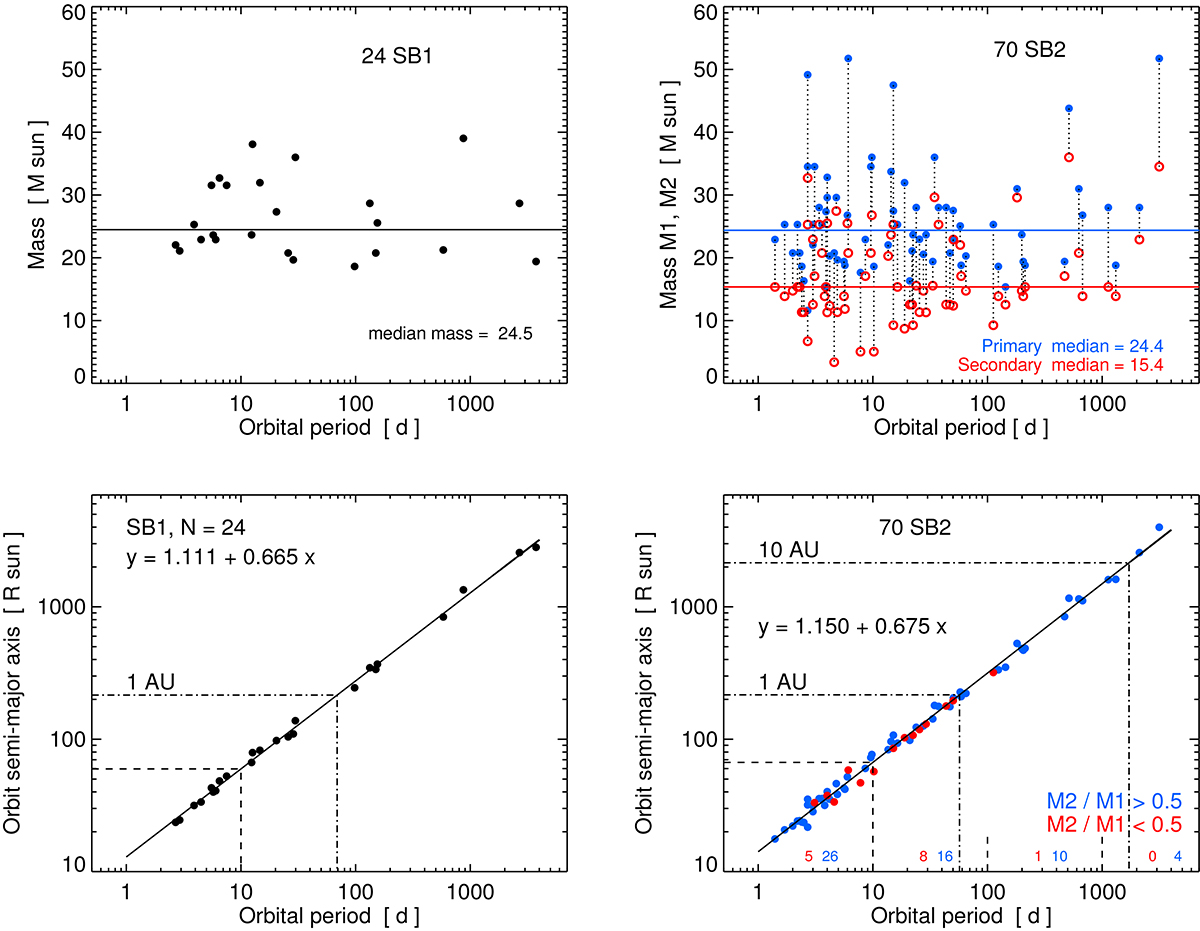
Fig. 12.
Download original image
Calibration mass and semi-major axis vs. orbital period. Left for SB1 and right for SB2. Top: Mass, the horizontal line marks the median mass. Bottom: Semi-major axis, the solid line marks a least-squares fit to the data (logarithmic, with the fit equation labelled). The vertical and horizontal lines are for guidance (dashed and dotted). Bottom right: Blue and red distinguish the mass ratio, the coloured numbers give the number of SB2s in the Porb bins separated by Porb = 10, 100, 1000.
Current usage metrics show cumulative count of Article Views (full-text article views including HTML views, PDF and ePub downloads, according to the available data) and Abstracts Views on Vision4Press platform.
Data correspond to usage on the plateform after 2015. The current usage metrics is available 48-96 hours after online publication and is updated daily on week days.
Initial download of the metrics may take a while.