Fig. 1.
Download original image
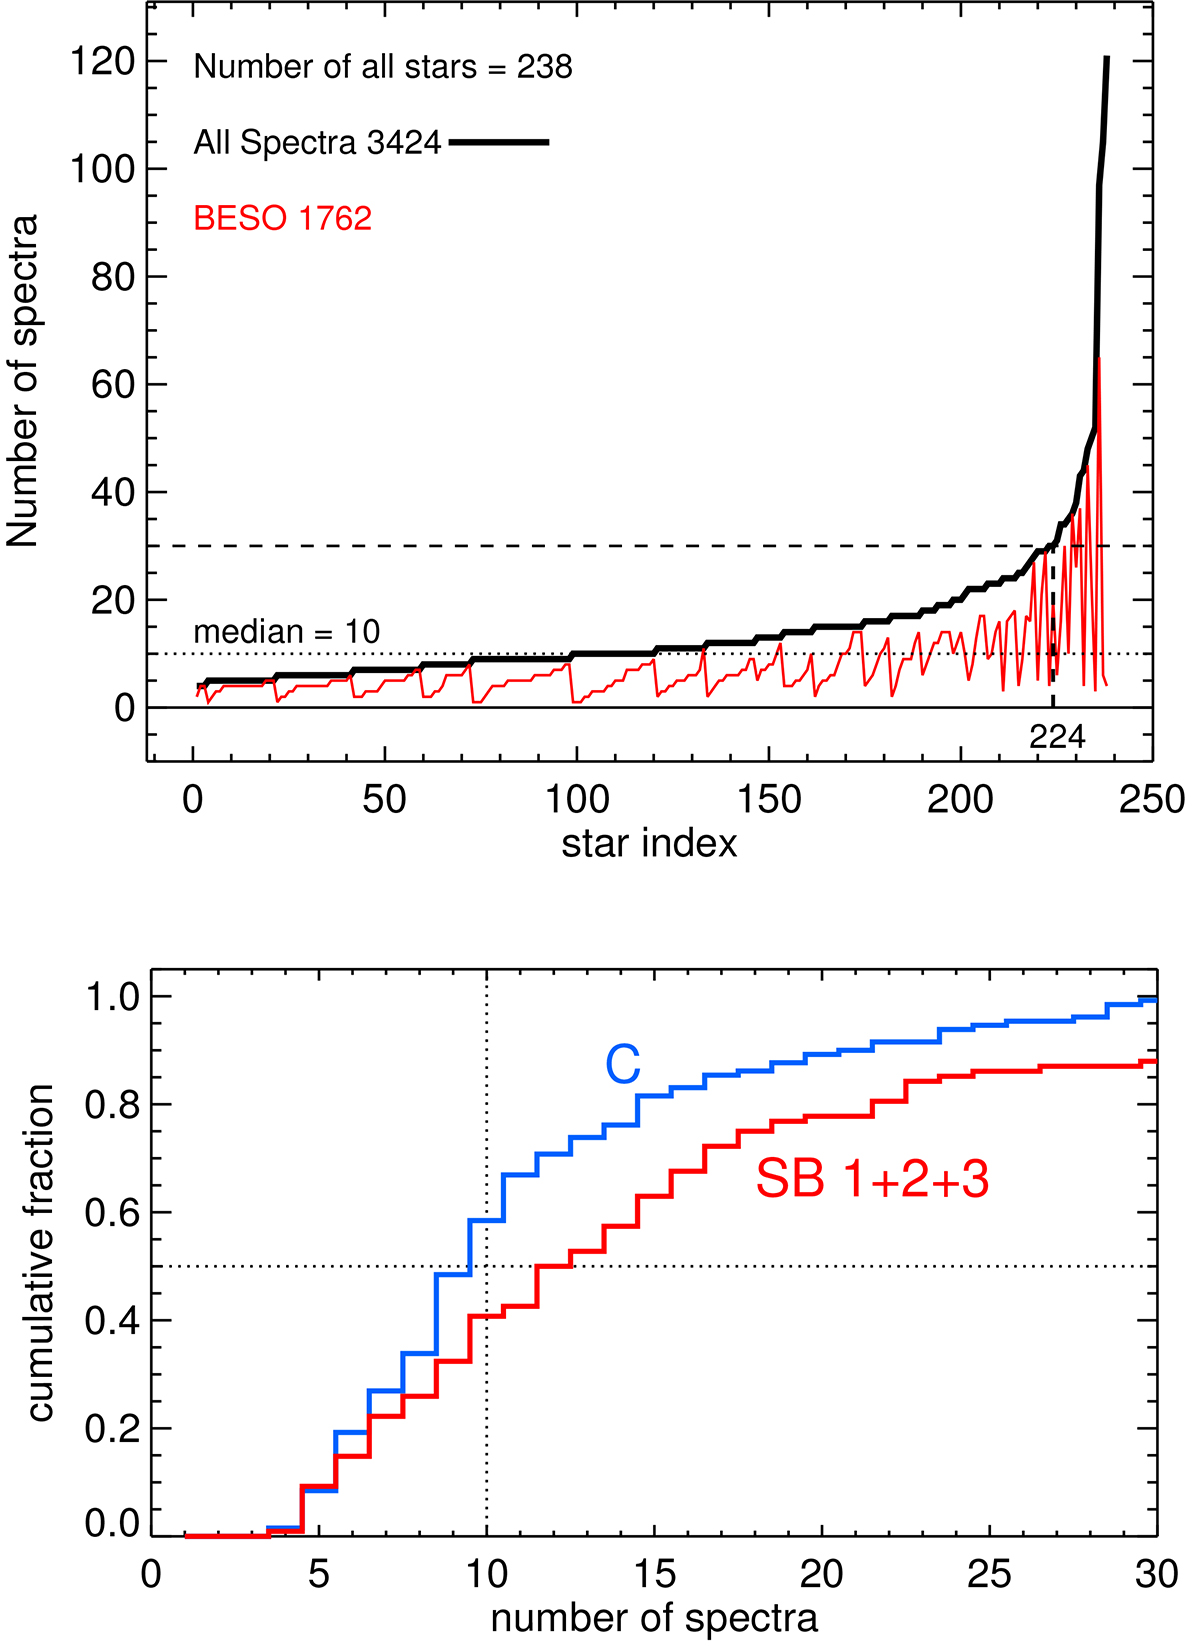
Statistics of the spectra. Top: Number of spectra per star. The star index is sorted in ascending order of the total number of spectra per star (Ntot, black), and for equal Ntot in ascending order of the number of BESO spectra (red). Bottom: Cumulative fraction of the number of spectra for Cs and SBs, zoomed in to the range 0–30. The dotted lines mark the median; Cs have statistically (about 9/12) fewer spectra than SBs.
Current usage metrics show cumulative count of Article Views (full-text article views including HTML views, PDF and ePub downloads, according to the available data) and Abstracts Views on Vision4Press platform.
Data correspond to usage on the plateform after 2015. The current usage metrics is available 48-96 hours after online publication and is updated daily on week days.
Initial download of the metrics may take a while.