Fig. 4
Download original image
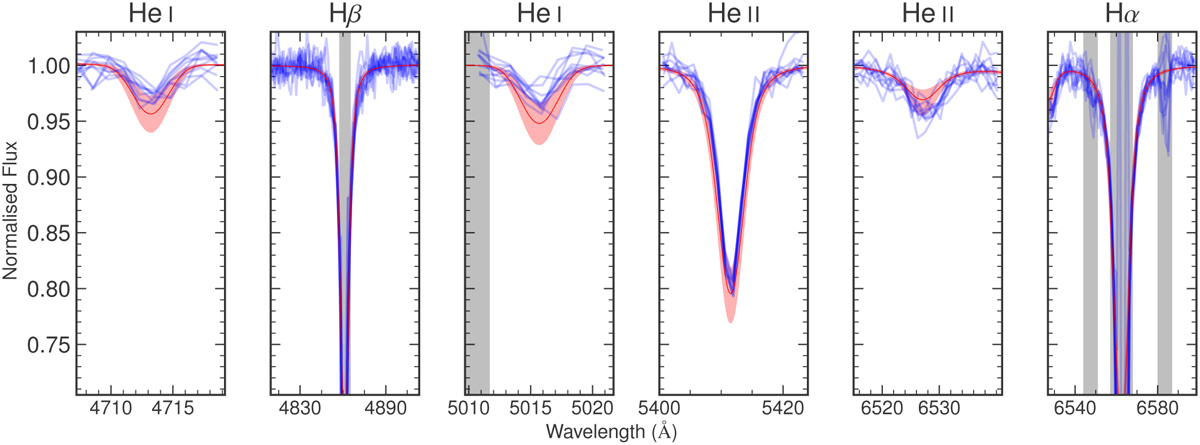
Synthetic spectrum created from the median sampler results for SSN 22 (red), with the normalised MUSE observations (blue), each observation shifted by the median RV sampler result for that observation. The red shading above and below the synthetic spectrum indicates the limit of all error bounds combined (as determined in the method described in Section 3.5), also including the largest error for RV of any observations. The shaded wavelength regions are not within the selected line regions detailed in Table 1 and so are not considered in the fitting process.
Current usage metrics show cumulative count of Article Views (full-text article views including HTML views, PDF and ePub downloads, according to the available data) and Abstracts Views on Vision4Press platform.
Data correspond to usage on the plateform after 2015. The current usage metrics is available 48-96 hours after online publication and is updated daily on week days.
Initial download of the metrics may take a while.