Fig. 10
Download original image
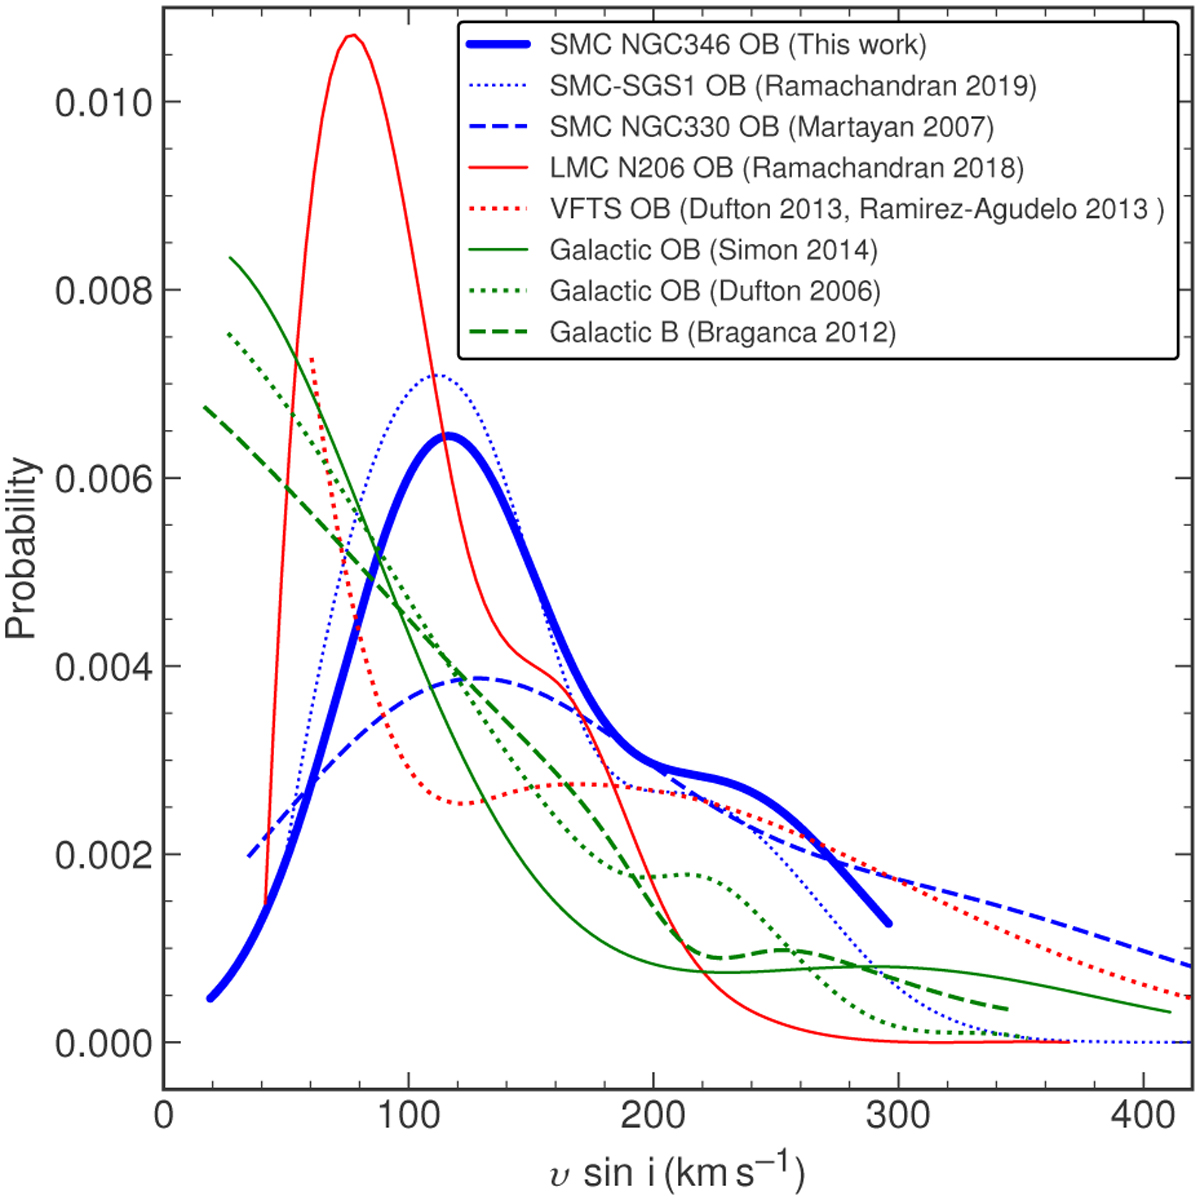
Projected rotational velocity probability distribution compared to numerous other SMC, LMC, and Milky Way samples. Blue lines: SMC samples–Blue solid line: this work (including macroturbulence, and thus a slight overestimation of ∼10km s−1). Blue dotted line: Ramachandran et al. (2019). Blue dashed line: Martayan et al. (2007). Red lines: LMC samples–Red solid line: Ramachandran et al. (2018). Red dotted line: Dufton et al. (2013) and Ramírez-Agudelo et al. (2013). Green lines: Galactic samples–Green solid line: Simón-Díaz & Herrero (2014). Green dashed line: Bragança et al. (2012). Green dotted line: Dufton et al. (2006).
Current usage metrics show cumulative count of Article Views (full-text article views including HTML views, PDF and ePub downloads, according to the available data) and Abstracts Views on Vision4Press platform.
Data correspond to usage on the plateform after 2015. The current usage metrics is available 48-96 hours after online publication and is updated daily on week days.
Initial download of the metrics may take a while.