Fig. 8
Download original image
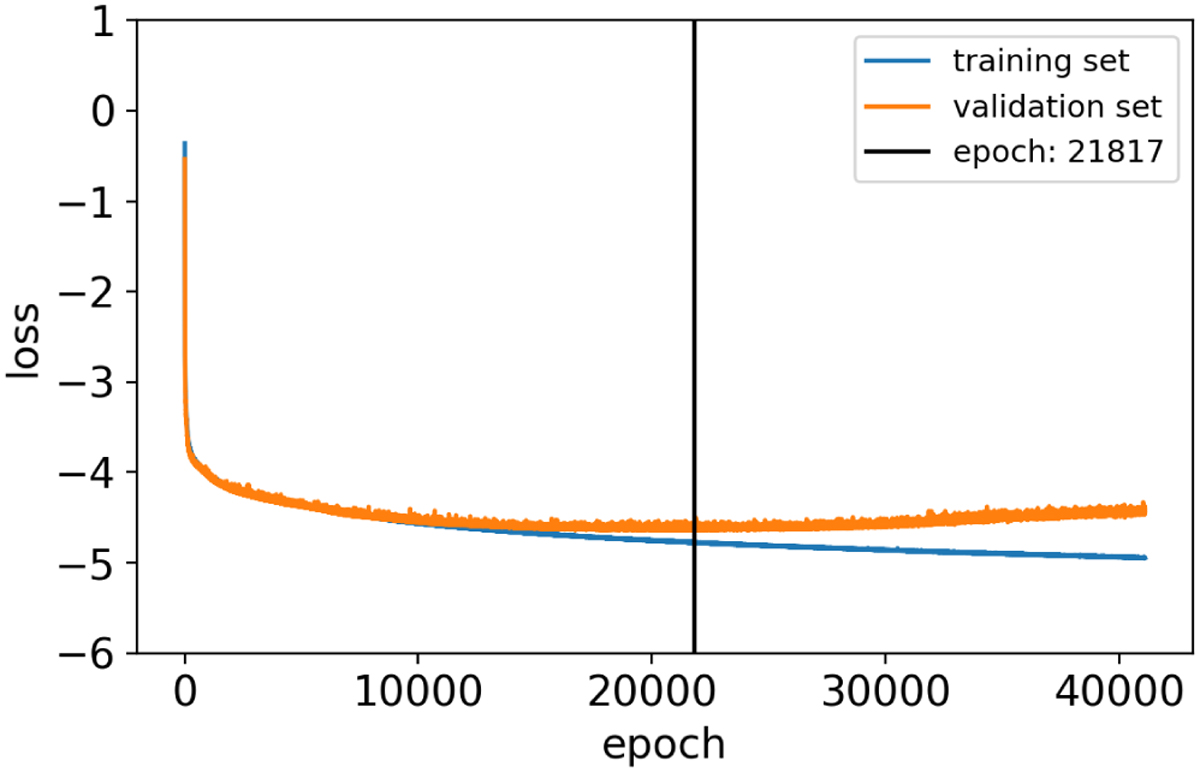
Training and validation loss of the LSTM-FCNN as a function of the training epoch. The vertical line marks the state at which we use the LSTM-FCNN where the validation loss is the lowest with the additional requirement that the bias is lower than 0.05 day. The plot shows that with more training epochs the network improves its performance while around epoch 22 000 the validation loss starts to increase again while the training loss still decreases because the LSTM-FCNN starts to overfit, meaning that, for example, it fits to specific noise patterns present in the training set.
Current usage metrics show cumulative count of Article Views (full-text article views including HTML views, PDF and ePub downloads, according to the available data) and Abstracts Views on Vision4Press platform.
Data correspond to usage on the plateform after 2015. The current usage metrics is available 48-96 hours after online publication and is updated daily on week days.
Initial download of the metrics may take a while.