Fig. 7
Download original image
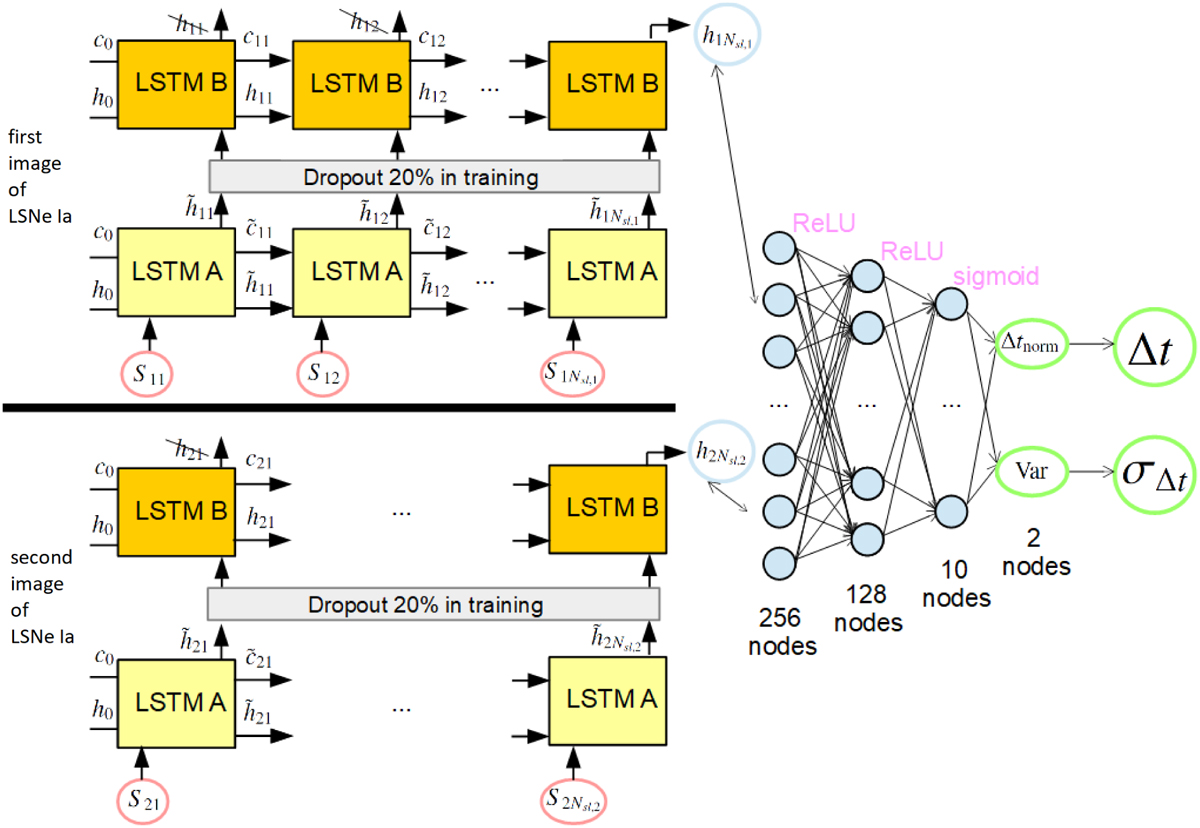
Illustration of our LSTM-FCNN composed of a Siamese LSTM network and a FCNN with two hidden layers. Details about the LSTM cells are shown in Fig. 6. Both sub-LSTM networks for image one (top, input denoted by S 1k) and image two (bottom, input denoted by S2k) are the same LSTM network (i.e., with the same weights in the neural network) composed of 2 layers (LSTM A and LSTM B) where during the training process, a dropout rate of 20% is used. We use only the last outputs ![]() from the second layer. These outputs are concatenated to be the input for the FCNN with two hidden layers using ReLU activation functions and a sigmoid activation for the final output. Given that the data is normalized the output of the network, tnorm and Var, needs to be converted to get the time delay Δt (see Eq. (21)) and the uncertainty of the time delay σΔt (see Sect. 4). The initial cell state c0 and hidden state h0 have the size Nhidden with all elements being equal to zero.
from the second layer. These outputs are concatenated to be the input for the FCNN with two hidden layers using ReLU activation functions and a sigmoid activation for the final output. Given that the data is normalized the output of the network, tnorm and Var, needs to be converted to get the time delay Δt (see Eq. (21)) and the uncertainty of the time delay σΔt (see Sect. 4). The initial cell state c0 and hidden state h0 have the size Nhidden with all elements being equal to zero.
Current usage metrics show cumulative count of Article Views (full-text article views including HTML views, PDF and ePub downloads, according to the available data) and Abstracts Views on Vision4Press platform.
Data correspond to usage on the plateform after 2015. The current usage metrics is available 48-96 hours after online publication and is updated daily on week days.
Initial download of the metrics may take a while.