Fig. 12
Download original image
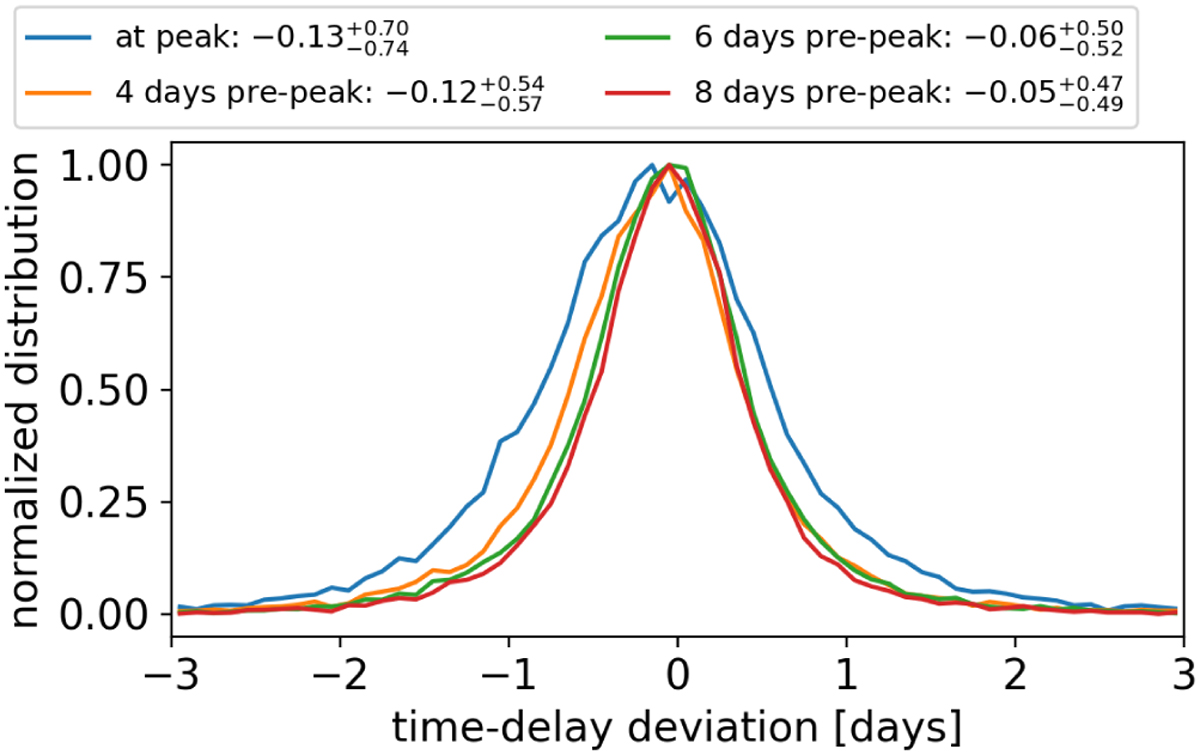
Evaluation on a specific LSN Ia system at zs = 0.76 with (κ1,γ1, s1) = (0.25, 0.27, 0.6) for image one and (κ2,γ2, s2) = (0.83, 0.81, 0.6) for image two as in Huber et al. (2022) for at peak detection and three cases where the first SN image is detected before peak (in observer-frame days). The light curves are simulated in the same way as those in the SNEMO15-only test set. As was expected, the precision drops with less available data points pre-peak, but the uncertainty of ∼0.7 day for at-peak detection is still good. The accuracy is worse than in Fig. 9, which shows that the spread presented there is not only due to various noise and microlensing configurations but also comes from different types of LSNe Ia, although the bias cancels out if a large variety of systems is investigated.
Current usage metrics show cumulative count of Article Views (full-text article views including HTML views, PDF and ePub downloads, according to the available data) and Abstracts Views on Vision4Press platform.
Data correspond to usage on the plateform after 2015. The current usage metrics is available 48-96 hours after online publication and is updated daily on week days.
Initial download of the metrics may take a while.