Fig. 1
Download original image
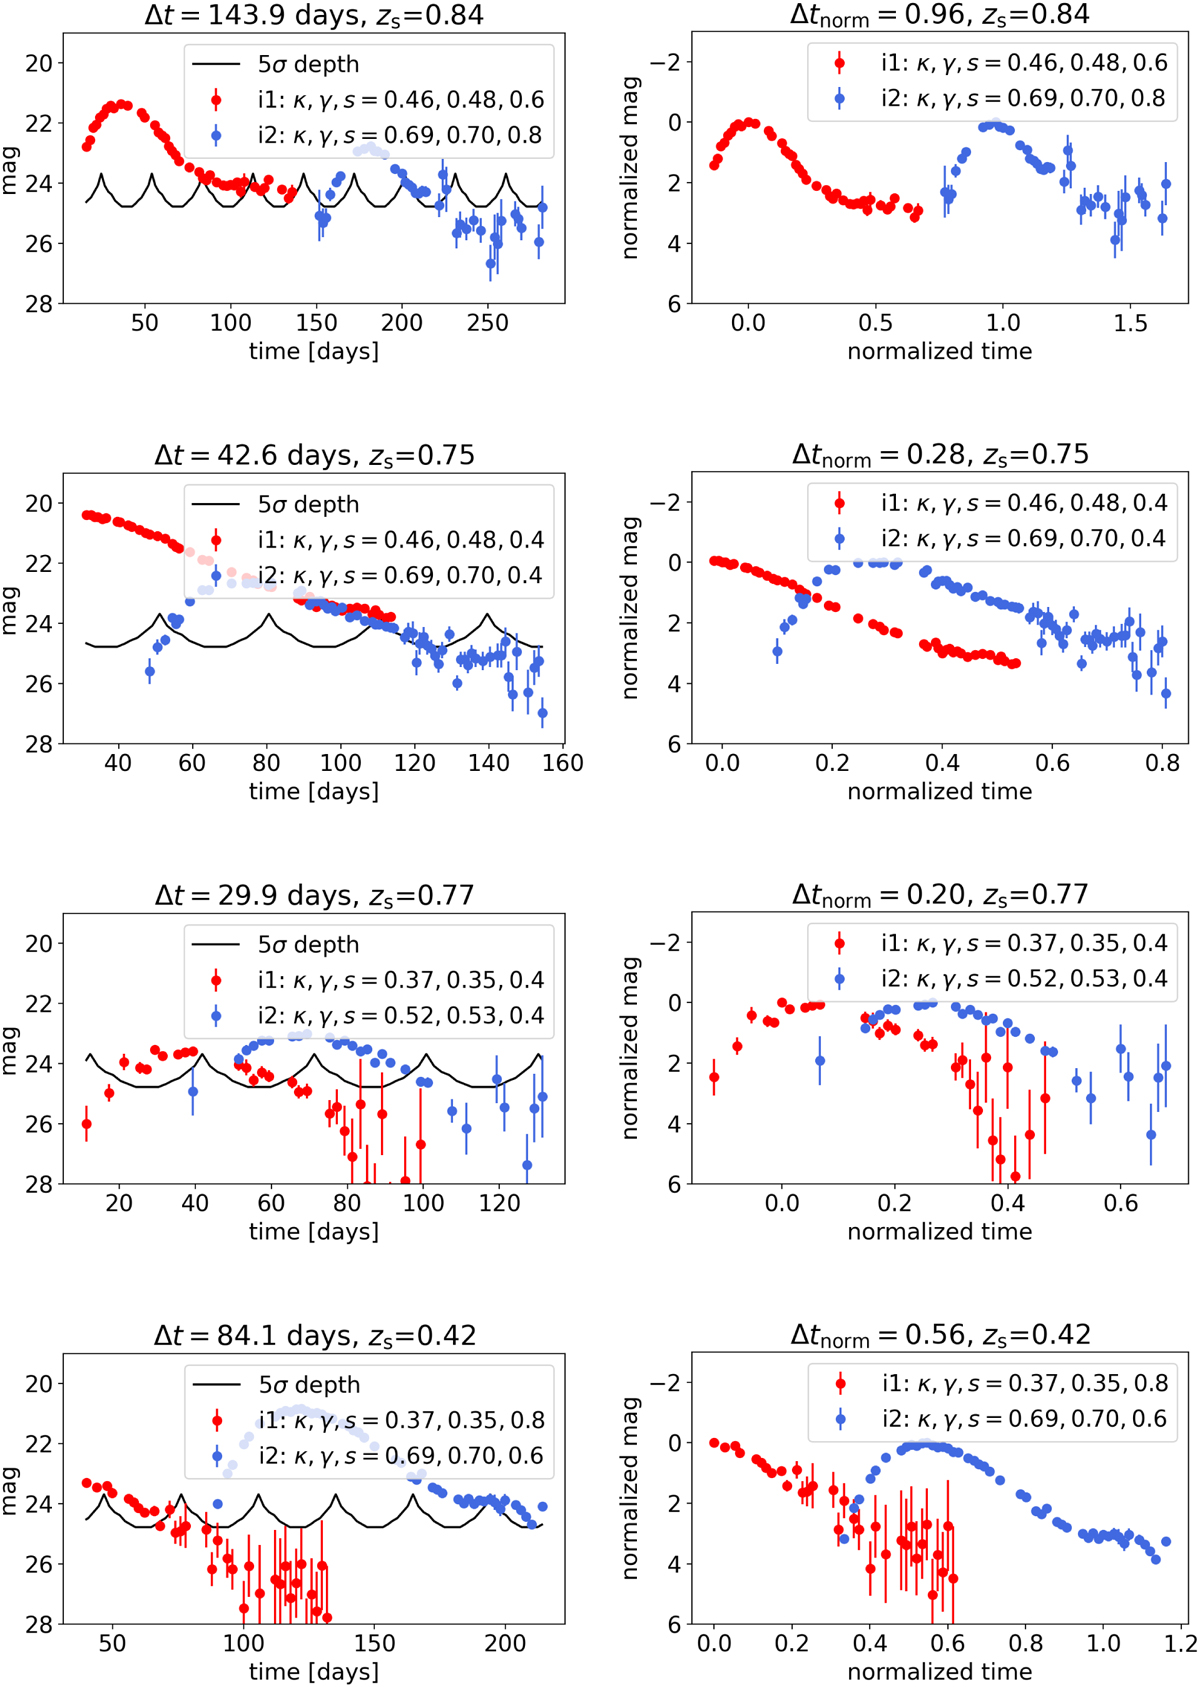
Four random samples of our training set, comparing data without normalization (left panels) and data with normalization (right panels) that will be used for our machine-learning network. The red and blue data points are the i-band light curves for the first and the second, respectively, lensed SN image. The black curves in the left panels show the i-band 5σ limiting depth, which oscillates with the moon phase. The normalization procedure to obtain the right panels from the left panels is described in Sect. 2.2.
Current usage metrics show cumulative count of Article Views (full-text article views including HTML views, PDF and ePub downloads, according to the available data) and Abstracts Views on Vision4Press platform.
Data correspond to usage on the plateform after 2015. The current usage metrics is available 48-96 hours after online publication and is updated daily on week days.
Initial download of the metrics may take a while.