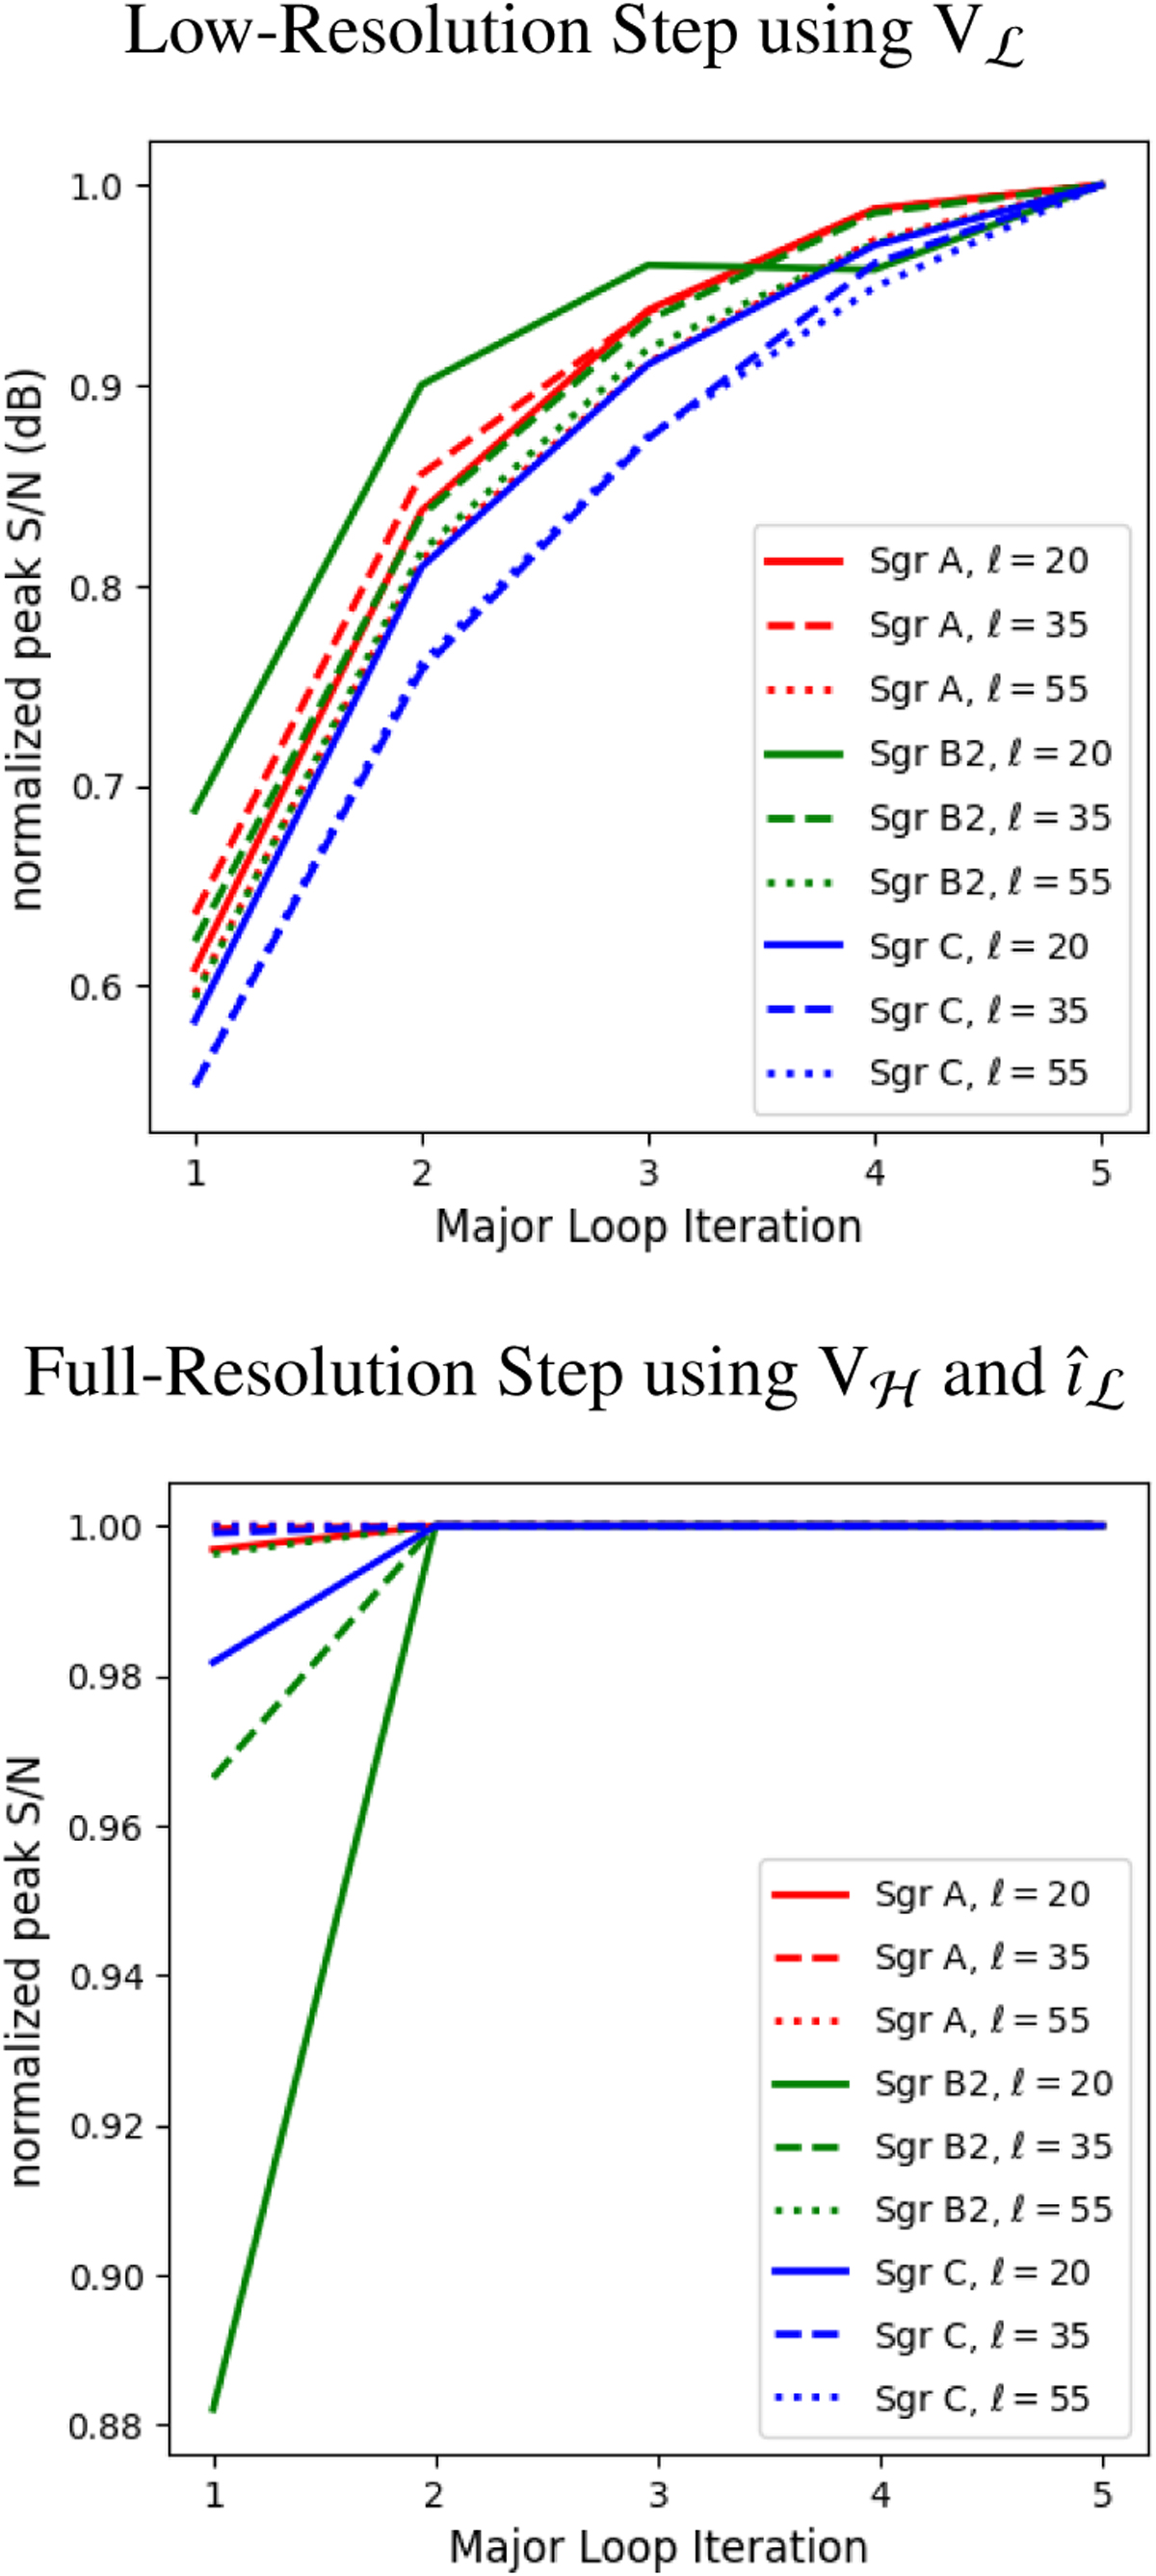
Fig. 7
Download original image
Progression of peak S/N of reconstructed images for various partitioning configurations across the major cycles for both the low- and full-resolution reconstruction steps. peak S/Ns have been normalized by the maximum value of each configuration to allow for easier comparison. An exponential scale is used for the bottom image to better illustrate the differences between the different configurations. We fixed δ = 5 here, as we found it does not greatly impact the results.
Current usage metrics show cumulative count of Article Views (full-text article views including HTML views, PDF and ePub downloads, according to the available data) and Abstracts Views on Vision4Press platform.
Data correspond to usage on the plateform after 2015. The current usage metrics is available 48-96 hours after online publication and is updated daily on week days.
Initial download of the metrics may take a while.