Fig. A.3

Download original image
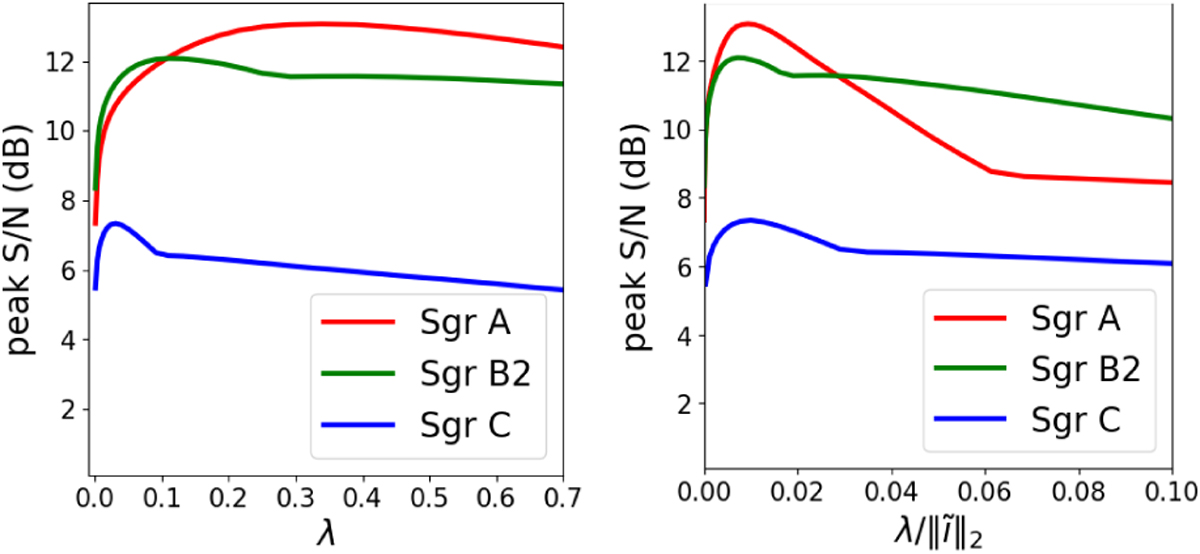
Reconstruction quality of images for our three datasets for different values of λ. The left image shows peak S/N in dB versus λ for the first major cycle for our three initial datasets, illustrating the different ideal values across different objects. This becomes less problematic when normalizing by the L2-norm of the dirty image ||ĩ1||2. As shown on the right, ![]() is much better behaved, with the region of wellperforming values all roughly lining up. The reconstruction algorithm used here is the single-step sparsity regularized method that reconstructs using all visibilities without partitioning.
is much better behaved, with the region of wellperforming values all roughly lining up. The reconstruction algorithm used here is the single-step sparsity regularized method that reconstructs using all visibilities without partitioning.
Current usage metrics show cumulative count of Article Views (full-text article views including HTML views, PDF and ePub downloads, according to the available data) and Abstracts Views on Vision4Press platform.
Data correspond to usage on the plateform after 2015. The current usage metrics is available 48-96 hours after online publication and is updated daily on week days.
Initial download of the metrics may take a while.


