Fig. 1
Download original image
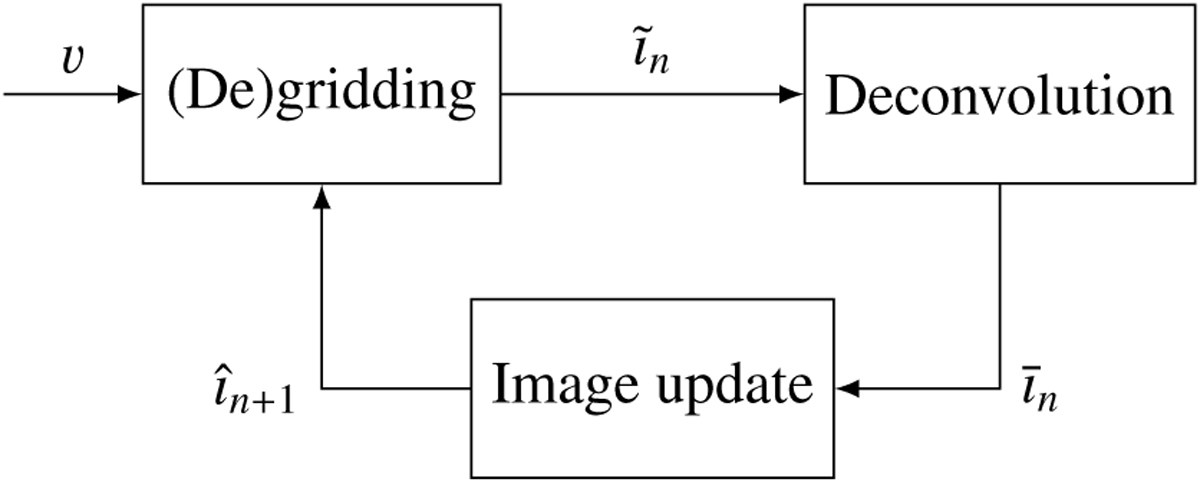
High-level overview of the radio-interferometric pipeline. A reconstructed image în is compared to the measurements v in the (de)gridding step, which outputs the difference in the spatial domain ĩn. This is passed to the reconstruction algorithm, which generates the next estimate în+1 by deconvolving the residual image ĩn and adding it to în.
Current usage metrics show cumulative count of Article Views (full-text article views including HTML views, PDF and ePub downloads, according to the available data) and Abstracts Views on Vision4Press platform.
Data correspond to usage on the plateform after 2015. The current usage metrics is available 48-96 hours after online publication and is updated daily on week days.
Initial download of the metrics may take a while.