Open Access
Fig. 9.
Download original image
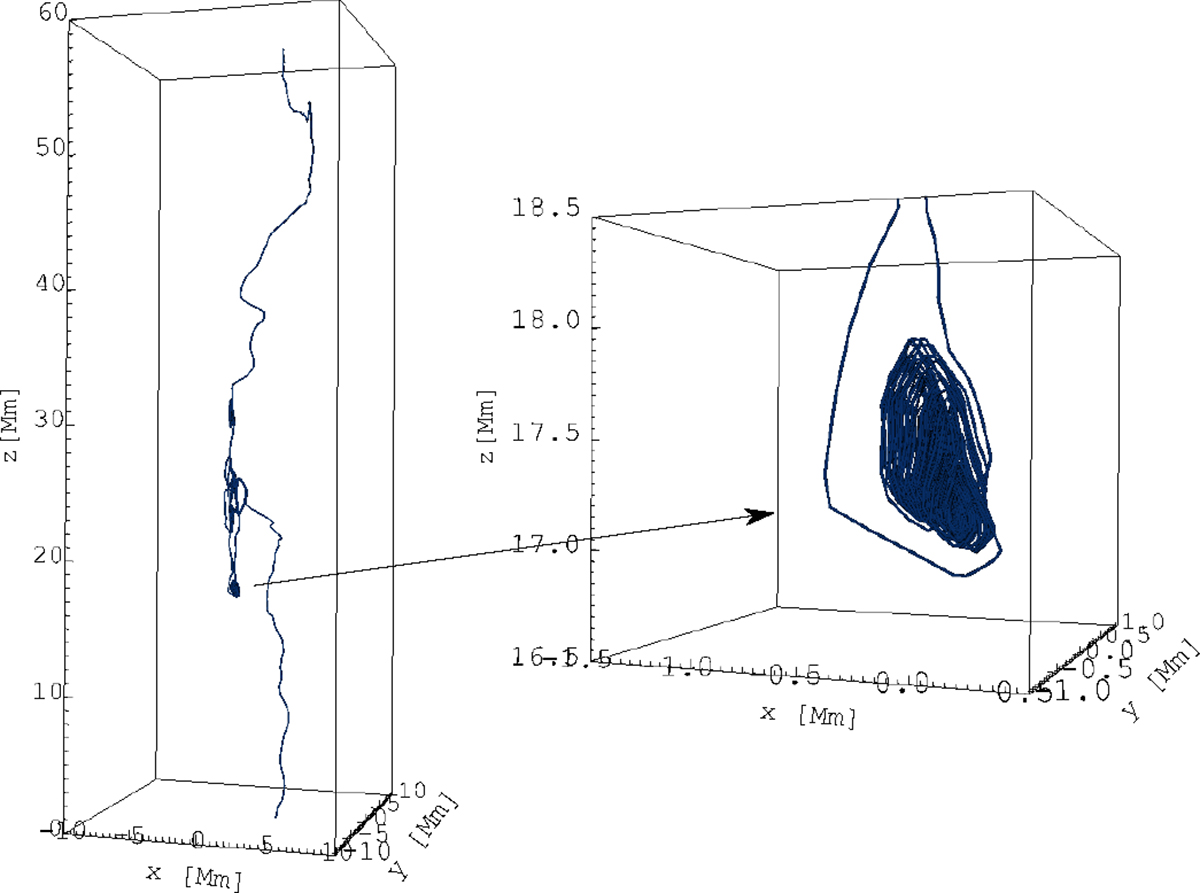
Example of the magnetic field cocoon at time t = 616 s. On the left is shown the selected magnetic line starting at the point (x = 3.175, y = −0.5, z = 0 Mm). On the right is a detailed view of the magnetic cocoon at the same time, expressed by the single magnetic field line.
Current usage metrics show cumulative count of Article Views (full-text article views including HTML views, PDF and ePub downloads, according to the available data) and Abstracts Views on Vision4Press platform.
Data correspond to usage on the plateform after 2015. The current usage metrics is available 48-96 hours after online publication and is updated daily on week days.
Initial download of the metrics may take a while.