Open Access
Fig. 1.
Download original image
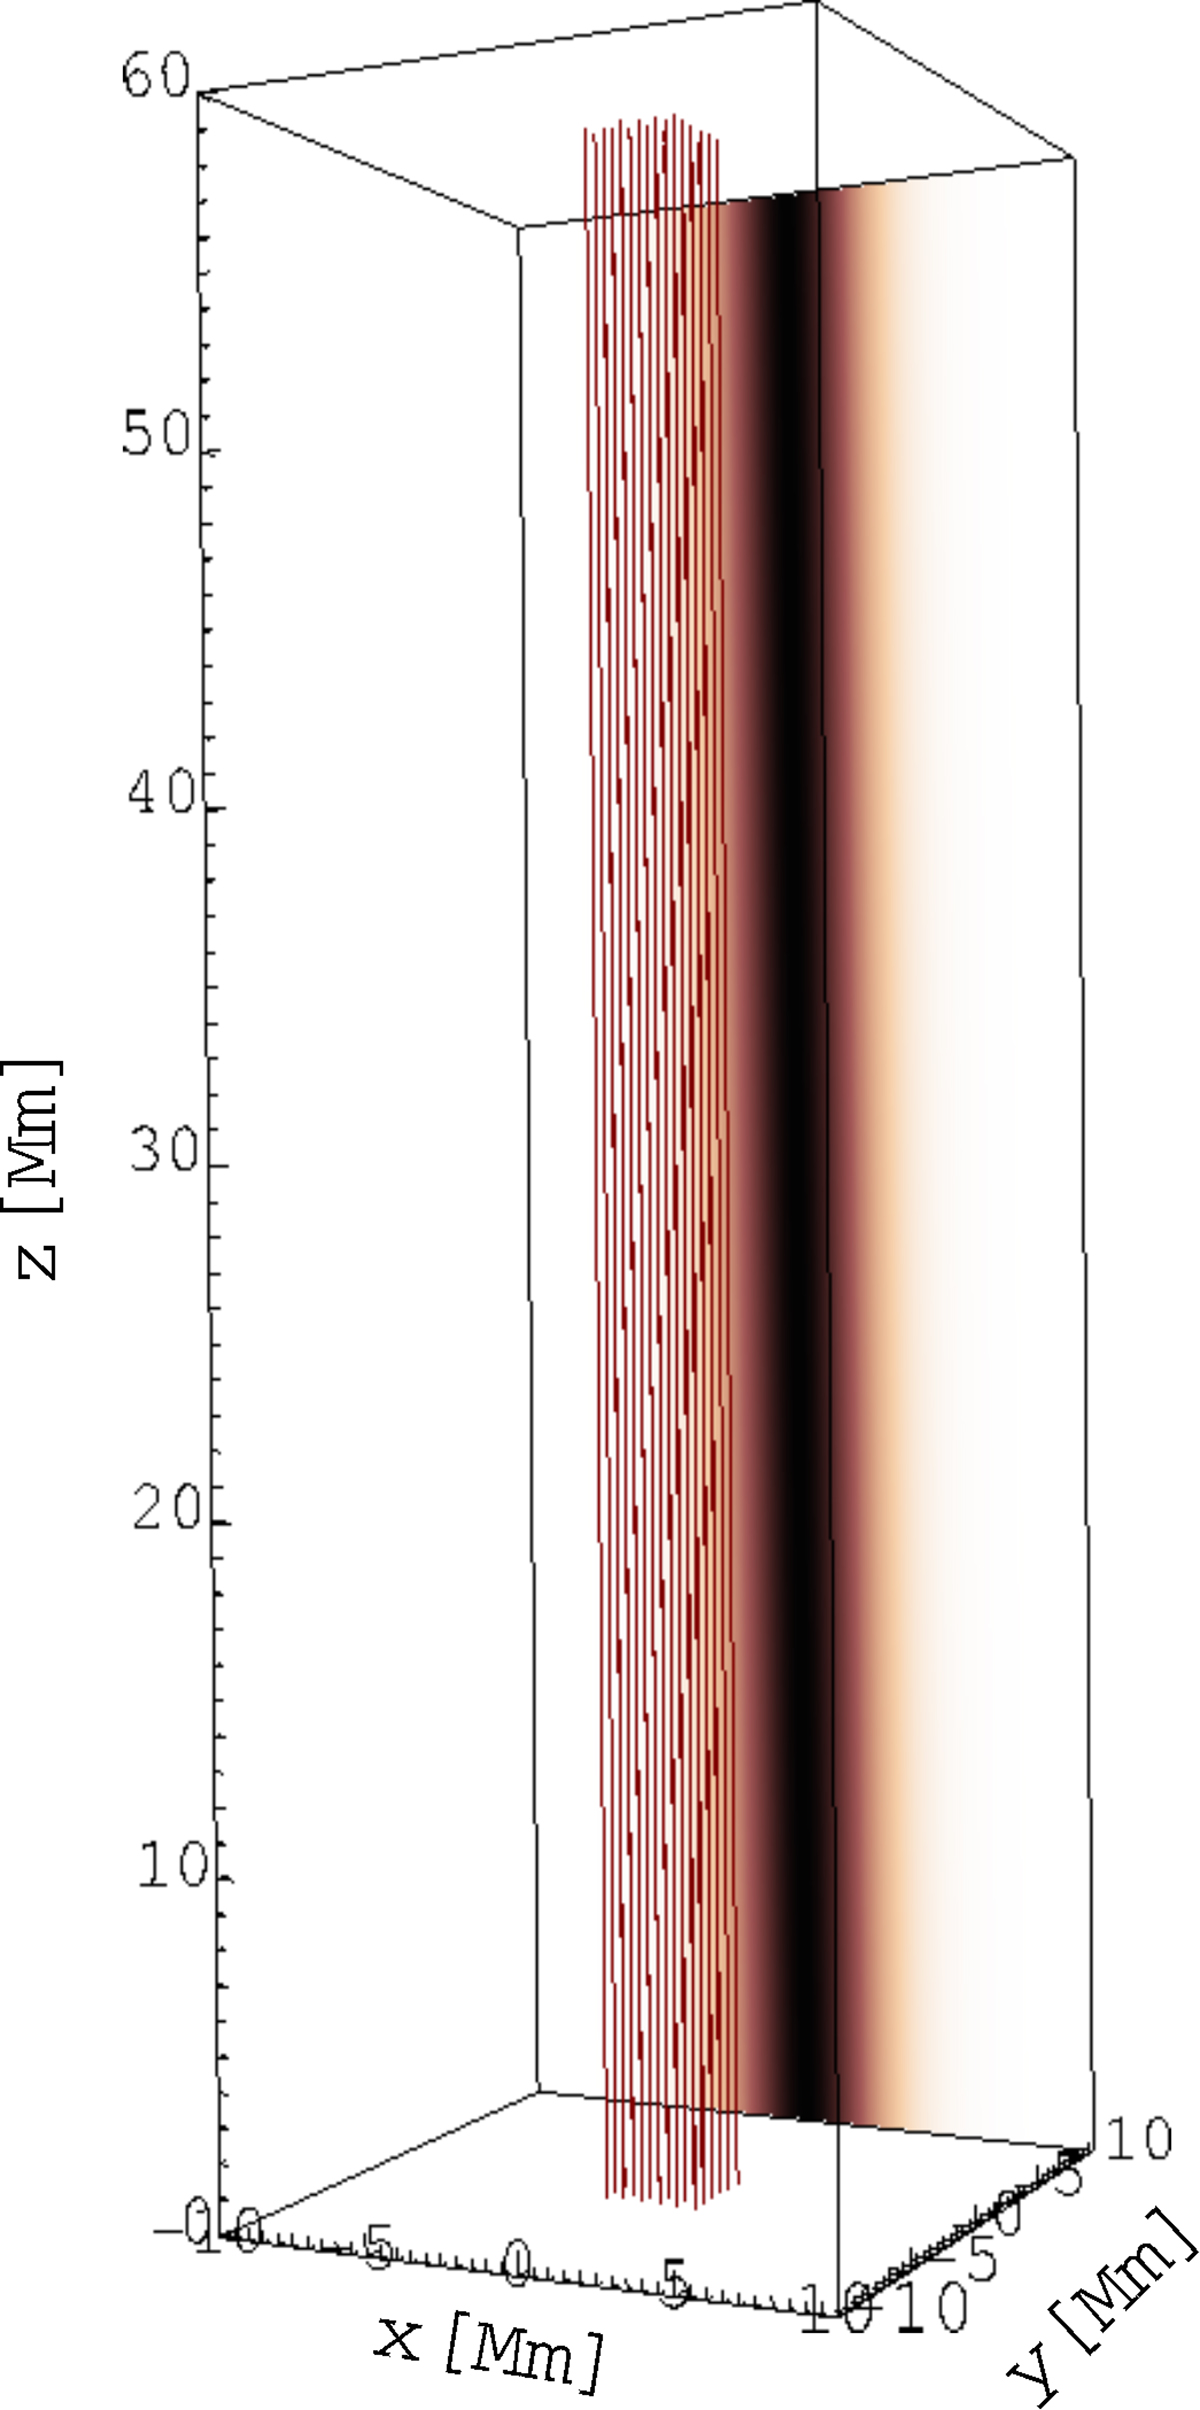
Initial state of the model: magnetic field lines (solid red lines) starting at the bottom plane of the numerical box at the same positions as those in Fig. 3. The mass density is shown as a slice in the x–z plane at the box boundary.
Current usage metrics show cumulative count of Article Views (full-text article views including HTML views, PDF and ePub downloads, according to the available data) and Abstracts Views on Vision4Press platform.
Data correspond to usage on the plateform after 2015. The current usage metrics is available 48-96 hours after online publication and is updated daily on week days.
Initial download of the metrics may take a while.