Fig. 4.
Download original image
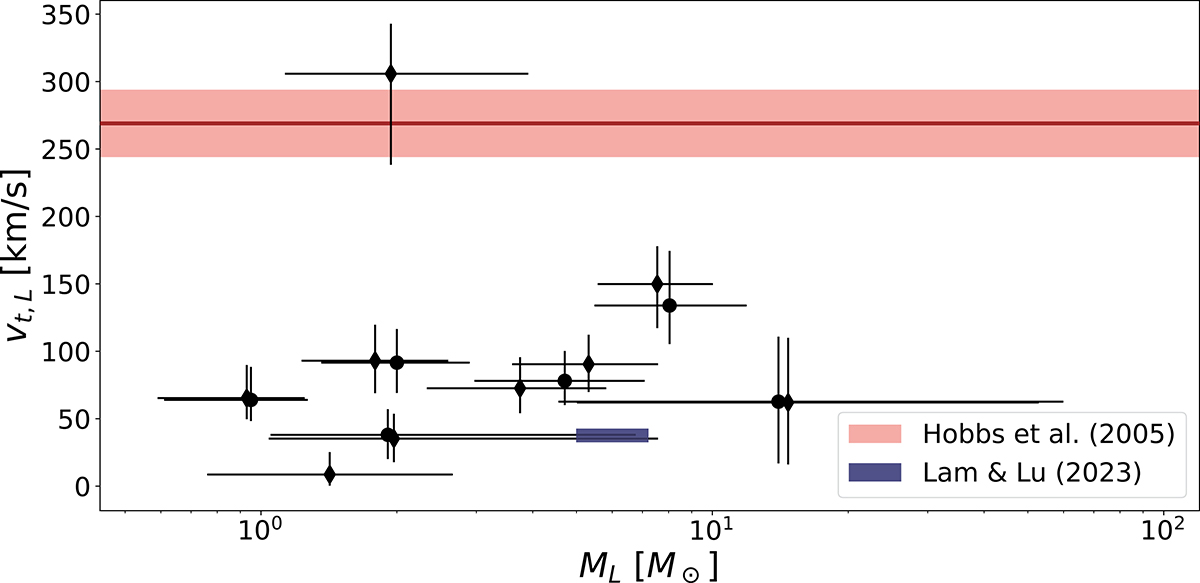
Transverse velocities, vt, L, estimated for nine candidate events using DarkLensCode and Gaia proper motion measurements. ML is the mass of the lens. Black dots represent estimates of the masses and velocities of the nine candidates with error bars as lines, and each solution is plotted separately. We marked solutions with positive u0 with circles and negative ones with diamonds. The red line represents the median transverse velocity of NS from Hobbs et al. (2005), with a light red rectangle representing their dispersion. The dark blue rectangle represents the mass and transverse velocity of the BH from Lam & Lu (2023).
Current usage metrics show cumulative count of Article Views (full-text article views including HTML views, PDF and ePub downloads, according to the available data) and Abstracts Views on Vision4Press platform.
Data correspond to usage on the plateform after 2015. The current usage metrics is available 48-96 hours after online publication and is updated daily on week days.
Initial download of the metrics may take a while.