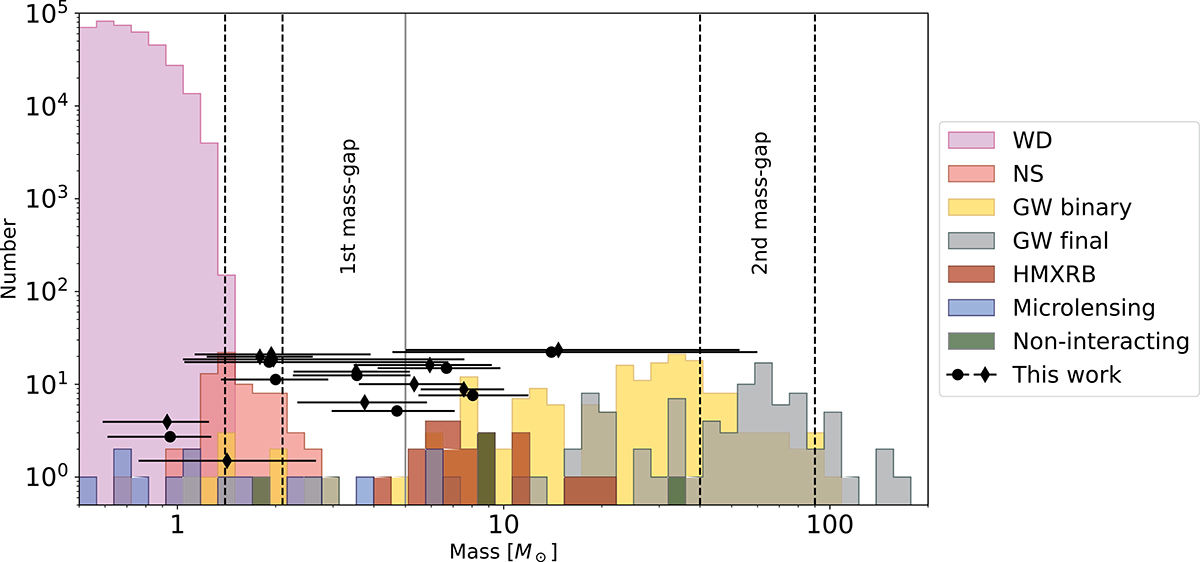
Fig. 3.
Download original image
Distribution of known masses of WDs, NS and BHs. Light pink marks WDs known from Gaia (Gentile Fusillo et al. 2021). In light red we marked NS with known masses coming from John Antoniadis’s catalogue (Lattimer 2012; Antoniadis 2013). Objects found by gravitational wave detectors were marked in yellow (Abbott et al. 2019, 2021a, 2024, 2023, 2021b). In red we marked high mass x-ray binaries (Orosz et al. 2007; Val-Baker et al. 2007; Orosz et al. 2009, 2014; Corral-Santana et al. 2016; Miller-Jones et al. 2021). In light blue, we marked candidates for dark remnants found by microlensing (Sahu et al. 2017; Kaczmarek et al. 2022; Kruszyńska et al. 2022; Jabłońska et al. 2022; McGill et al. 2023), including Lam & Lu (2023). In olive, we marked non-interacting dark remnants (Shenar et al. 2022; El-Badry et al. 2023b,a; Chakrabarti et al. 2023; El-Badry et al. 2024; Panuzzo 2024). Black dots mark masses of objects known from this work. Each solution for the event is shown separately. We marked solutions with positive u0 with circles, and negative with diamonds. Dashed, vertical lines mark different mass thresholds: the left-most is the Chandrasekhar mass limit, second to the left is the Tolman-Volkoff-Oppenheimer limit, and two right-most mark the limits for the theoretical pair-instability supernovae region (Farmer et al. 2020). A solid vertical line marks the conventional limit of 5 M⊙ for the lightest BHs. Data used to create this plot can be found in a GitHub repository.
Current usage metrics show cumulative count of Article Views (full-text article views including HTML views, PDF and ePub downloads, according to the available data) and Abstracts Views on Vision4Press platform.
Data correspond to usage on the plateform after 2015. The current usage metrics is available 48-96 hours after online publication and is updated daily on week days.
Initial download of the metrics may take a while.