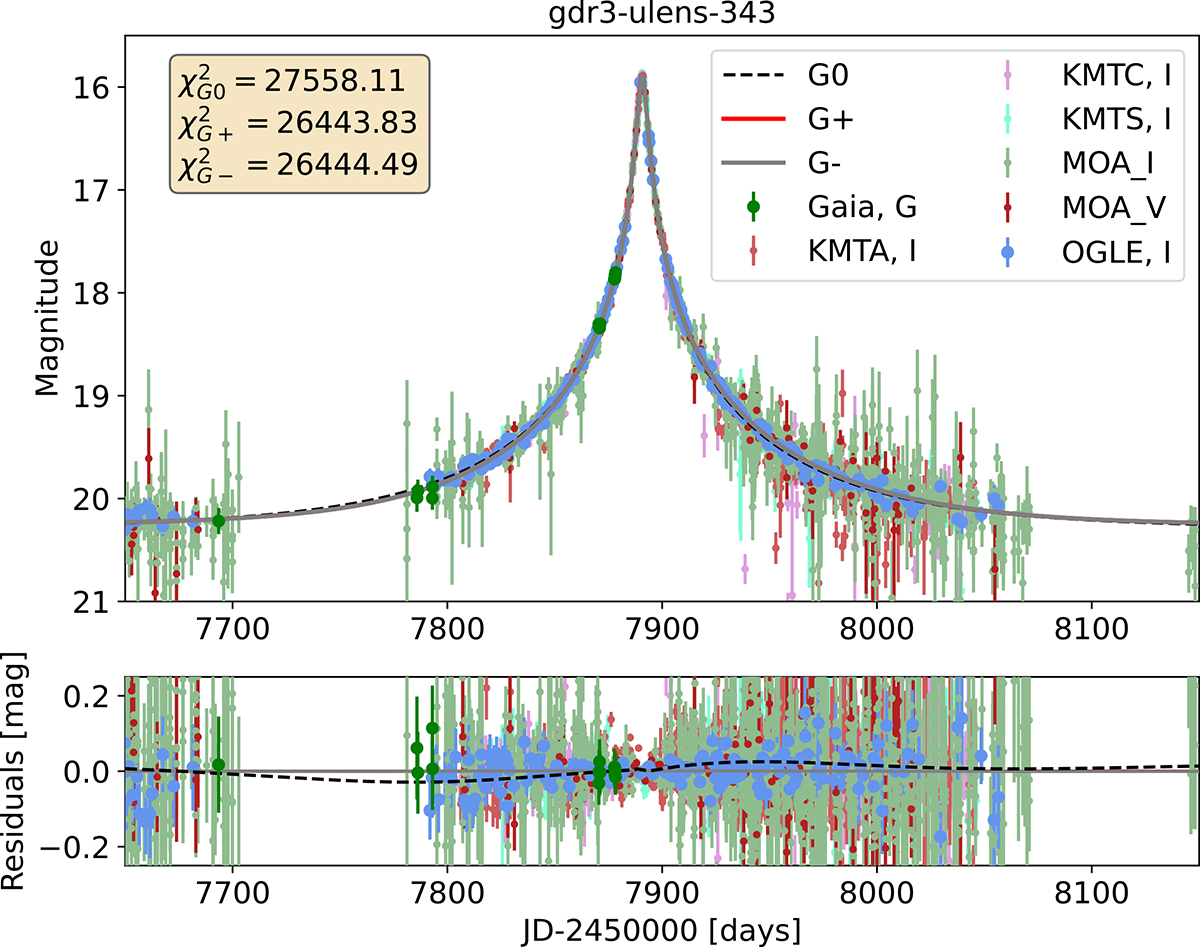
Fig. 1.
Download original image
Light curve of the event known as GaiaDR3-ULENS-343, BLG502.29.100629 Mróz et al. (2019), OGLE-2017-BLG-0095, MOA-2017-BLG-160, and KMT-2017-BLG-1123, shown at the top. The GaiaG data is shown in green, GRP in red, KMTNet data is shown in dark red, violet and aqua for the South African Astronomical Observatory (KMTA), Cerro Tololo Inter-American Observatory (KMTC), and Siding Springs Observatory (KMTS), MOA I and V band data are shown in light green and dark red respectively, and OGLE in light-blue. The four solutions are marked: PSPL without parallax G0 with a black dashed line, and two PSPLs with parallax, G+ and G- with red and grey continuous lines respectively. The bracket in the top left shows the χ2 of different solutions. Bottom panel: Residuals of the G+ model. A Black dashed line marks the G0 and G+ models difference, while the dark grey continuous line marks the G+ and G- models difference, respectively.
Current usage metrics show cumulative count of Article Views (full-text article views including HTML views, PDF and ePub downloads, according to the available data) and Abstracts Views on Vision4Press platform.
Data correspond to usage on the plateform after 2015. The current usage metrics is available 48-96 hours after online publication and is updated daily on week days.
Initial download of the metrics may take a while.