Fig. 1
Download original image
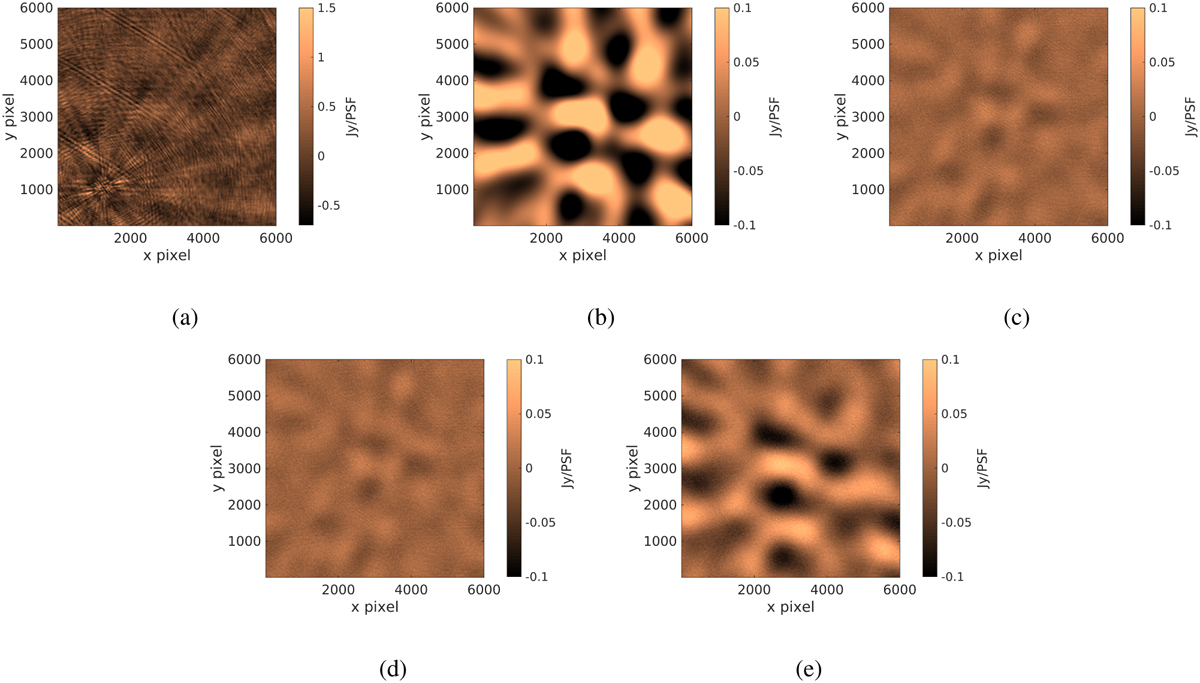
Sample images (Stokes I, not deconvolved, natural weights) made using simulated data, covering about 10 × 10 square degrees in the sky. (a) Image before calibration. (b) Diffuse sky and the weak sources that are hidden in the simulated data. (c) Residual image after calibration, only using spectral regularization. (d) Residual image after calibration with spectral and spatial regularization. (e) Residual image after calibration with spectral and spatial regularization and using the diffuse sky model. Images (b)–(e) have the same intensity scale.
Current usage metrics show cumulative count of Article Views (full-text article views including HTML views, PDF and ePub downloads, according to the available data) and Abstracts Views on Vision4Press platform.
Data correspond to usage on the plateform after 2015. The current usage metrics is available 48-96 hours after online publication and is updated daily on week days.
Initial download of the metrics may take a while.