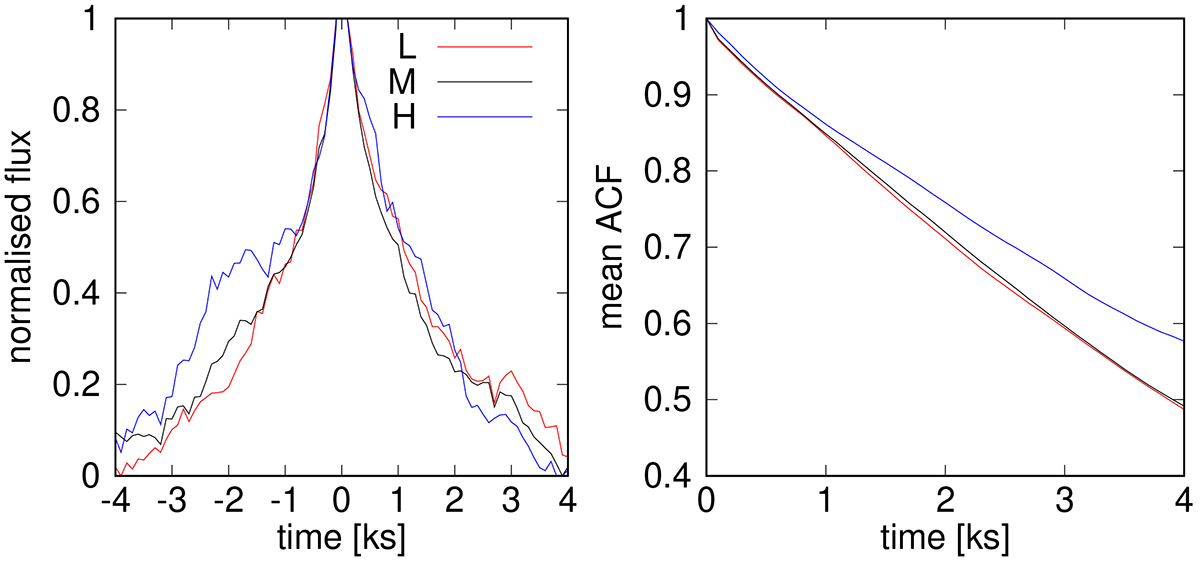
Fig. 6.
Download original image
Averaged flare profiles of IRAS 13224–3809 with the corresponding ACFs. Left panel: Same as the upper right panel of Fig. 4, but the IRAS 13224–3809 flares are calculated from low- (red line), low-medium (black line), and high- (blue line) flux subsamples of the IRAS 13224–3809 light curve. Right panel: Mean ACFs of the same light-curve subsamples of IRAS 13224–3809.
Current usage metrics show cumulative count of Article Views (full-text article views including HTML views, PDF and ePub downloads, according to the available data) and Abstracts Views on Vision4Press platform.
Data correspond to usage on the plateform after 2015. The current usage metrics is available 48-96 hours after online publication and is updated daily on week days.
Initial download of the metrics may take a while.