Fig. 4.
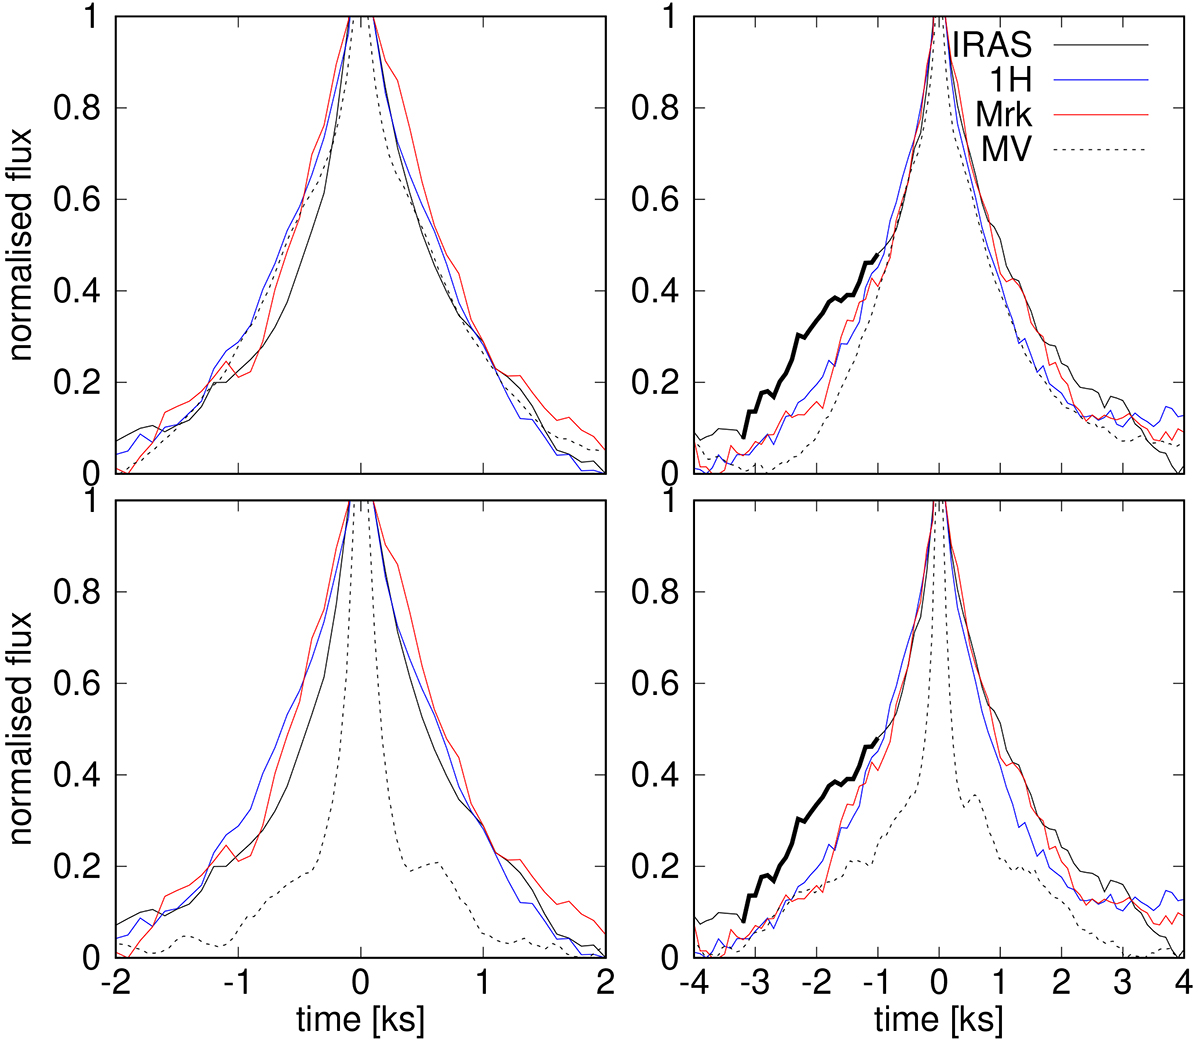
Download original image
Averaged flare profiles for two different time extensions (from −2 to 2 ks in the left panels, from −4 to 4 ks in the right panels). The three AGNs are compared to CV MV Lyr. The latter is shown in two different states: in a low (upper panels) and high (lower panels) state. The averaged number of the flares is summarised in Table 1. The thick black line shows the side lobe between −3.2 and −1 ks of IRAS 13224–3809, as discussed in the text.
Current usage metrics show cumulative count of Article Views (full-text article views including HTML views, PDF and ePub downloads, according to the available data) and Abstracts Views on Vision4Press platform.
Data correspond to usage on the plateform after 2015. The current usage metrics is available 48-96 hours after online publication and is updated daily on week days.
Initial download of the metrics may take a while.