Fig. 3.
Download original image
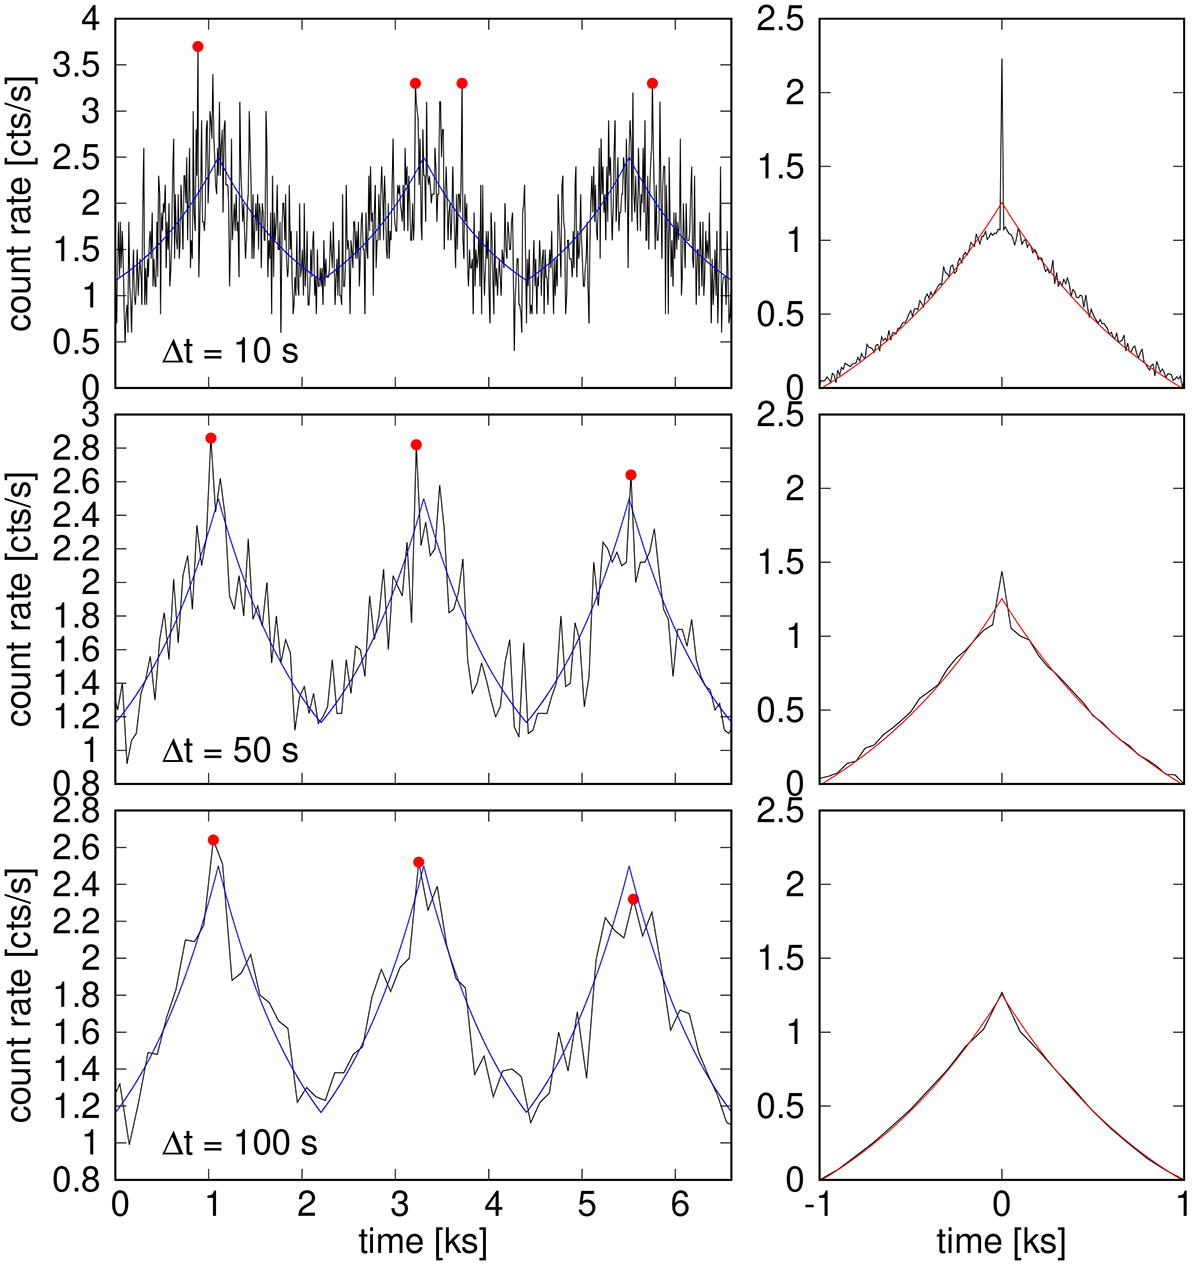
Simulated light curves with AFPs. Left panels: Light curves with synthetic flares using Eq. (1) and Fc = 2 cts/s, Fc = 0.5 cts/s, Tr = Td = 1000 s with Poisson noise. Different time bins Δt are shown. The detected flare maxima are shown as red points. Blue shows the original light curve without noise. Right panels: AFPs calculated from synthetic light curves with 200 flares. The red line depicts the reference light curve without noise.
Current usage metrics show cumulative count of Article Views (full-text article views including HTML views, PDF and ePub downloads, according to the available data) and Abstracts Views on Vision4Press platform.
Data correspond to usage on the plateform after 2015. The current usage metrics is available 48-96 hours after online publication and is updated daily on week days.
Initial download of the metrics may take a while.