Fig. 10.
Download original image
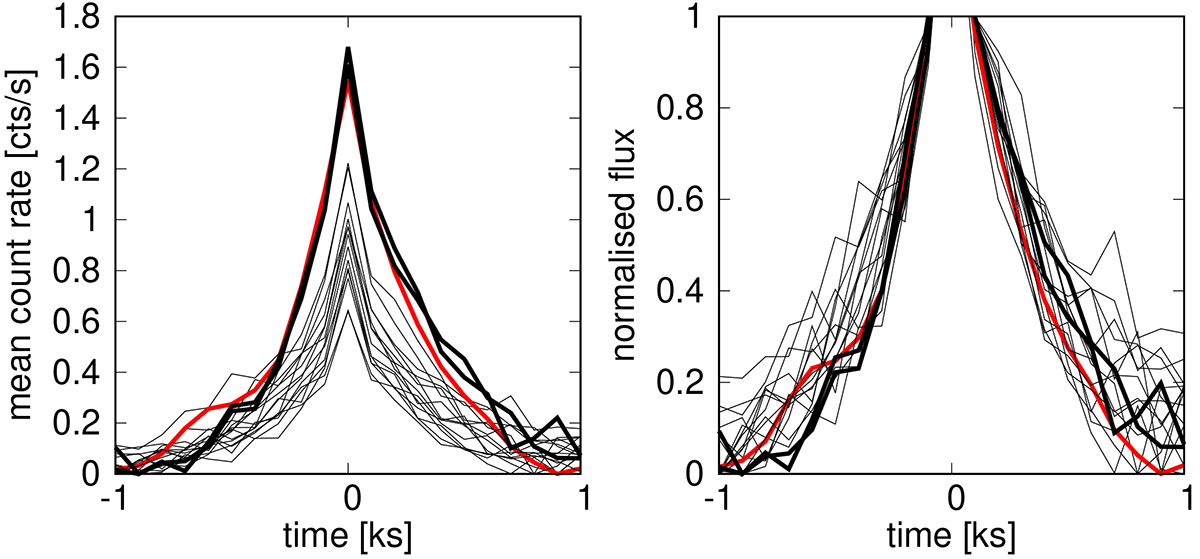
Averaged flare profiles from individual observations. The thick lines represent the ObsIDs 0780561601 (red), 0792180401 (black), and 0792180601 (black). The left panel represents the true amplitudes. The right panel shows the same comparison as in Fig. 4, where the central point is excluded and the resulting maxima are set to 1.
Current usage metrics show cumulative count of Article Views (full-text article views including HTML views, PDF and ePub downloads, according to the available data) and Abstracts Views on Vision4Press platform.
Data correspond to usage on the plateform after 2015. The current usage metrics is available 48-96 hours after online publication and is updated daily on week days.
Initial download of the metrics may take a while.