Open Access
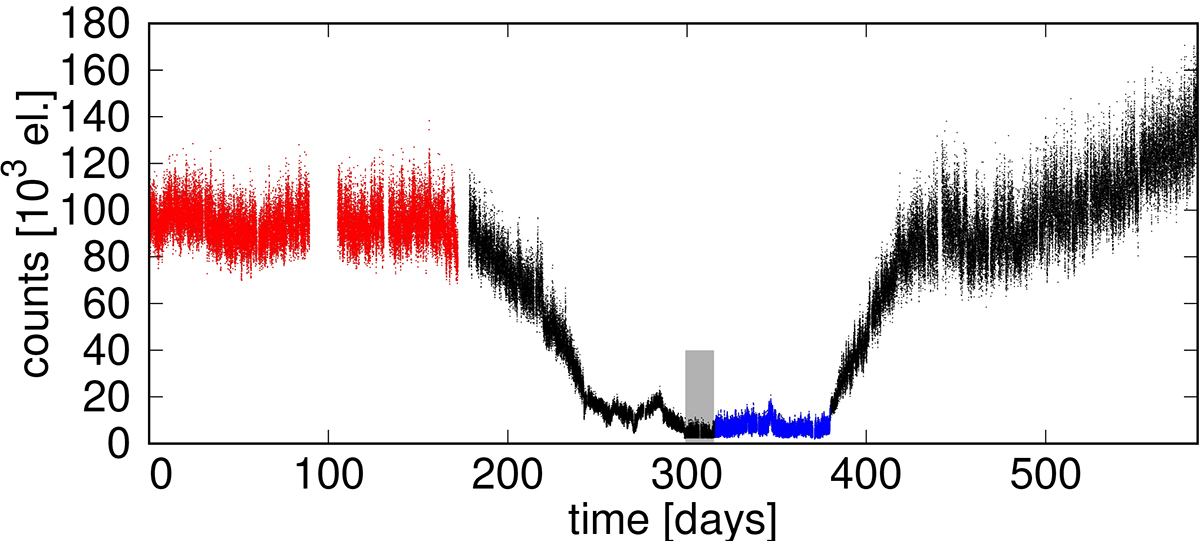
Fig. 1.
Download original image
Kepler light curve of MV Lyr during the transition from high to low state and vice versa. The red points represent the high-state interval we selected for the analysis, and the blue points are the selected low state. The shaded area represents the deep low state containing QPOs (see text for details).
Current usage metrics show cumulative count of Article Views (full-text article views including HTML views, PDF and ePub downloads, according to the available data) and Abstracts Views on Vision4Press platform.
Data correspond to usage on the plateform after 2015. The current usage metrics is available 48-96 hours after online publication and is updated daily on week days.
Initial download of the metrics may take a while.