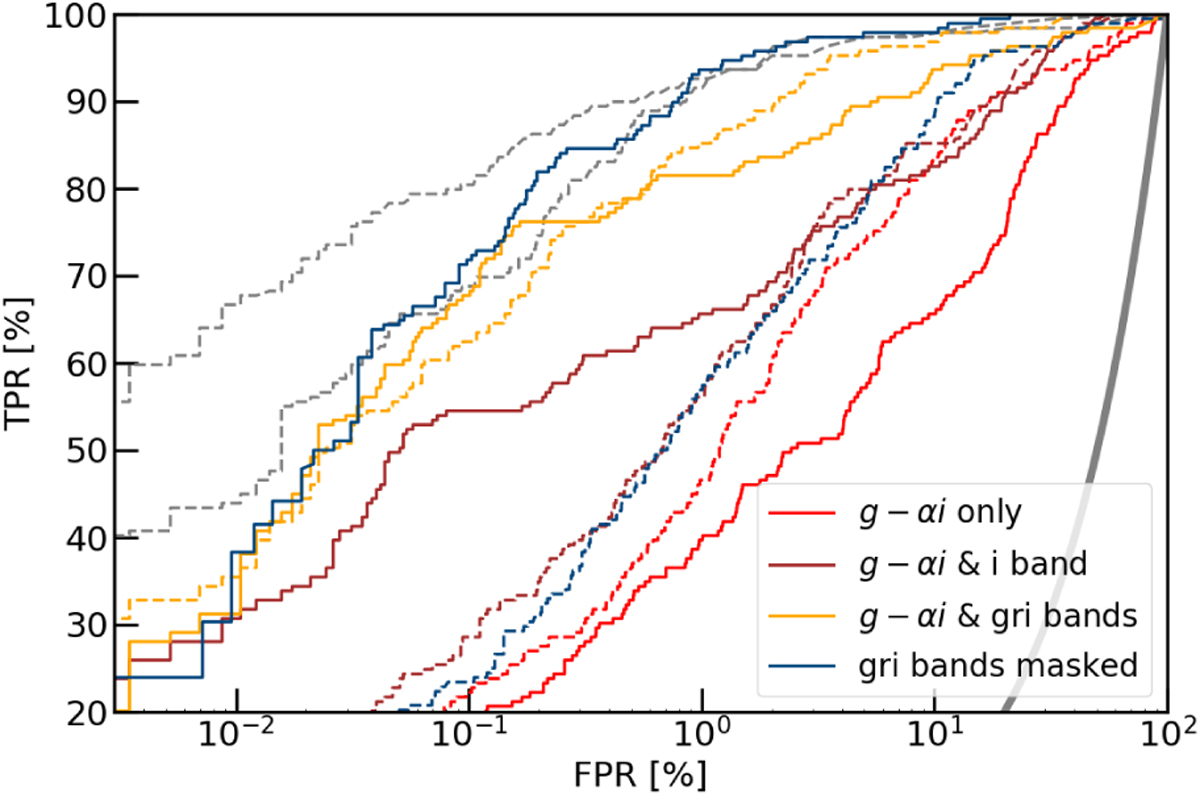
Fig. 9
Download original image
Performance of networks trained, validated and tested on difference images g – αi alone (red), joined with images from the i-band that has the best seeing (brown), or joined with the three gri-bands (orange). Blue curves show the baseline CNN (solid) and ResNet (dashed) trained, validated and tested on gri images with neighboring galaxies masked (see Section 5.8). For reference, the dashed gray lines show two good networks (the baseline ResNet and the ResNet from C21). The thick gray curve corresponds to a random classifier. We obtain a significant improvement in AUROC for the CNN after masking companions galaxies.
Current usage metrics show cumulative count of Article Views (full-text article views including HTML views, PDF and ePub downloads, according to the available data) and Abstracts Views on Vision4Press platform.
Data correspond to usage on the plateform after 2015. The current usage metrics is available 48-96 hours after online publication and is updated daily on week days.
Initial download of the metrics may take a while.