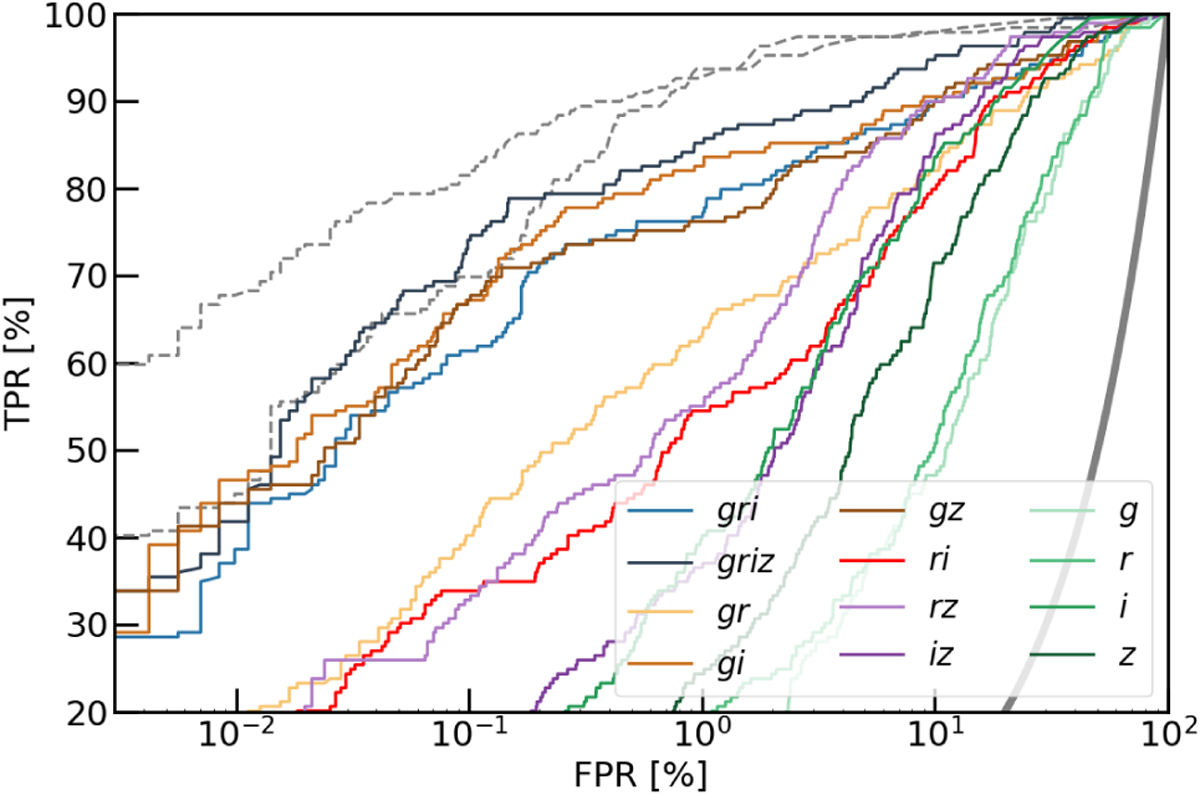
Fig. 6
Download original image
Receiver operating characteristic curves for training with different numbers of observing bands for the baseline CNN and the training set. For reference, the dashed gray lines show two good networks (the baseline ResNet and the ResNet from C21). The thick gray curve corresponds to a random classifier. Adding z-band to the standard gri three-band input helps increase the AUROC.
Current usage metrics show cumulative count of Article Views (full-text article views including HTML views, PDF and ePub downloads, according to the available data) and Abstracts Views on Vision4Press platform.
Data correspond to usage on the plateform after 2015. The current usage metrics is available 48-96 hours after online publication and is updated daily on week days.
Initial download of the metrics may take a while.