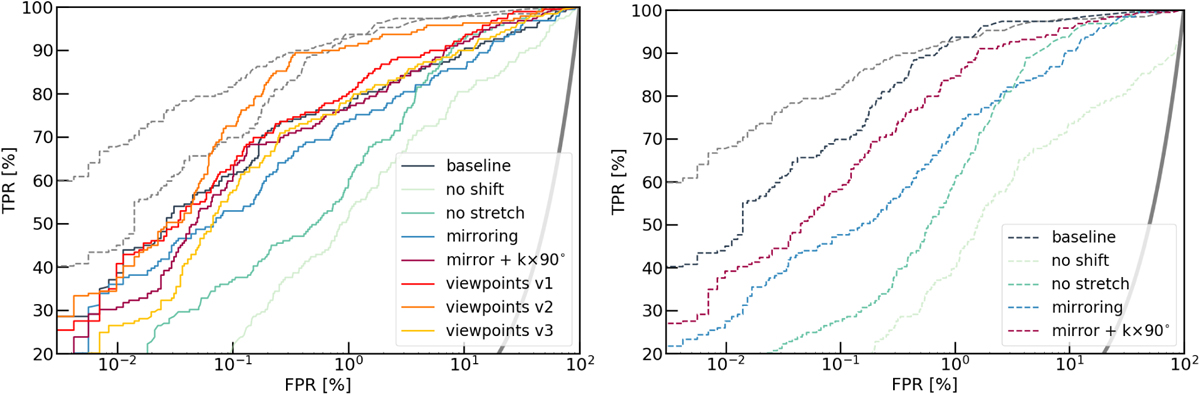
Fig. 5
Download original image
Influence of the data augmentation procedure for our baseline data set, and for the baseline CNN (left, solid lines) and ResNet (right, dashed lines) architectures. The standard data processing plotted in dark blue consists of applying random shifts to the image centroids and square-root scaling (defined as “stretch” in the figure). The light green curves show networks trained without centroid shifts, and the dark green curves illustrate the performance without square-root scaling. The blue and brown curves correspond to networks trained on images loaded together with the frames mirrored horizontally and vertically, in each of the three gri-bands, with (brown) and without (blue) random rotations by k × π/2. The red, orange, and yellow curves in the left panel show the CNNs trained using viewpoints of the original images as inputs (see Section 5.4 for details). For reference, the dashed gray lines show two good networks (the baseline ResNet and the ResNet from C21). The thick gray curve corresponds to a random classifier.
Current usage metrics show cumulative count of Article Views (full-text article views including HTML views, PDF and ePub downloads, according to the available data) and Abstracts Views on Vision4Press platform.
Data correspond to usage on the plateform after 2015. The current usage metrics is available 48-96 hours after online publication and is updated daily on week days.
Initial download of the metrics may take a while.