Open Access
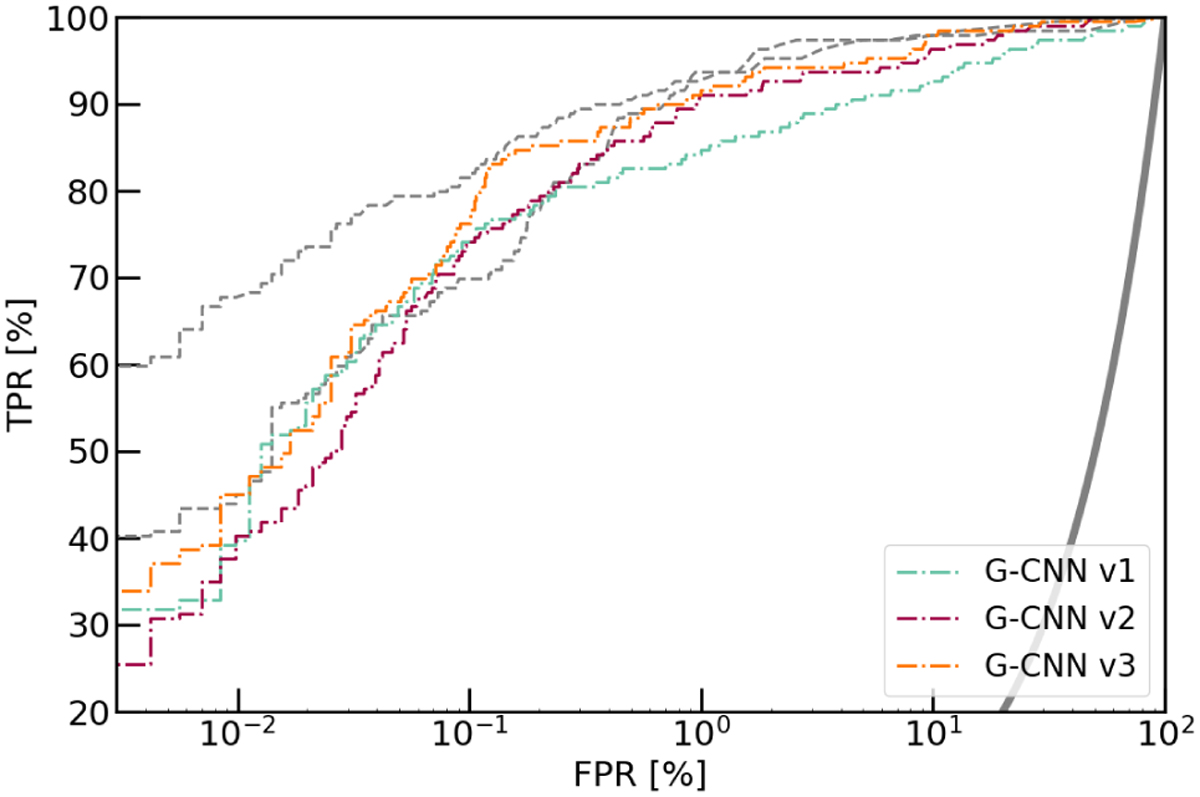
Fig. 4
Download original image
Influence of the network architecture for our baseline data set and the group-equivariant network architectures G-CNNs adapted from Cohen & Welling (2016). For reference, the dashed gray lines show two good networks (the baseline ResNet and the ResNet from C21). The thick gray curve corresponds to a random classifier.
Current usage metrics show cumulative count of Article Views (full-text article views including HTML views, PDF and ePub downloads, according to the available data) and Abstracts Views on Vision4Press platform.
Data correspond to usage on the plateform after 2015. The current usage metrics is available 48-96 hours after online publication and is updated daily on week days.
Initial download of the metrics may take a while.