Fig. 2
Download original image
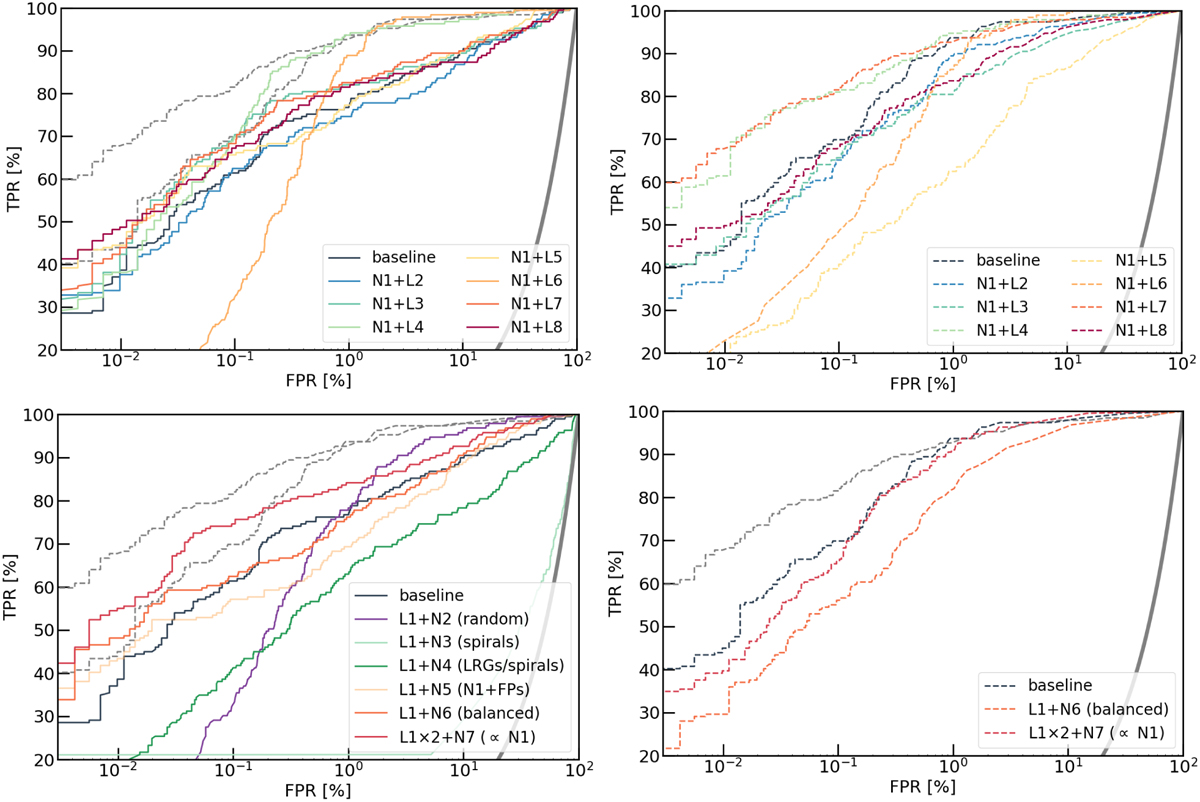
Influence of the training data set for our baseline CNN (left, solid lines) and ResNet (right, dashed lines). We only vary the set of positive (top) and negative (bottom) examples. Networks trained on the baseline data sets (N1+L1) are plotted in dark blue. Two of the best networks from the upper-right panel, the baseline ResNet (N1+L1) and the ResNet from C21 (N1+L7), are shown as dashed gray lines in all panels for reference (except in the right-hand panels where the colors are overlaid by the ones indicated in the legend). The thick gray curve corresponds to a random classifier. Optimal performance is obtained for ground-truth data sets comprising mock lenses with bright, deblended multiple images, and large fractions of typical non-lens contaminants. The AUROC, TPR0 and TPR10 tend to be higher for the ResNet, except for data sets containing limited numbers of tricky non-lens galaxies.
Current usage metrics show cumulative count of Article Views (full-text article views including HTML views, PDF and ePub downloads, according to the available data) and Abstracts Views on Vision4Press platform.
Data correspond to usage on the plateform after 2015. The current usage metrics is available 48-96 hours after online publication and is updated daily on week days.
Initial download of the metrics may take a while.