Fig. 11
Download original image
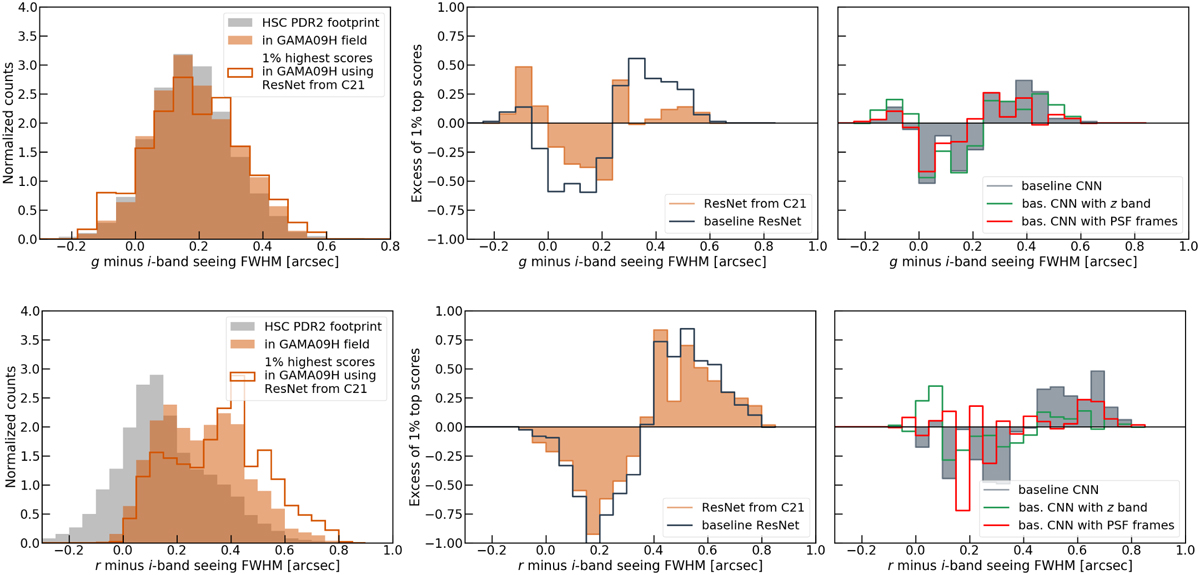
Histograms of seeing FWHM difference between pairs of bands. In the left panels, gray histograms show the average distributions over the entire HSC PDR2 footprint, and orange filled histograms show the distributions restricted to the GAMA09H field. In addition, step histograms show the distributions for galaxies within GAMA09H assigned the 1% highest scores by the ResNet from C21. In the middle panels, orange curves show the excess of the 1% top scores, obtained from the bin-per-bin difference between the step and filled orange histograms in the left panel. Other curves in the middle and right panels show this excess distribution for other networks.
Current usage metrics show cumulative count of Article Views (full-text article views including HTML views, PDF and ePub downloads, according to the available data) and Abstracts Views on Vision4Press platform.
Data correspond to usage on the plateform after 2015. The current usage metrics is available 48-96 hours after online publication and is updated daily on week days.
Initial download of the metrics may take a while.