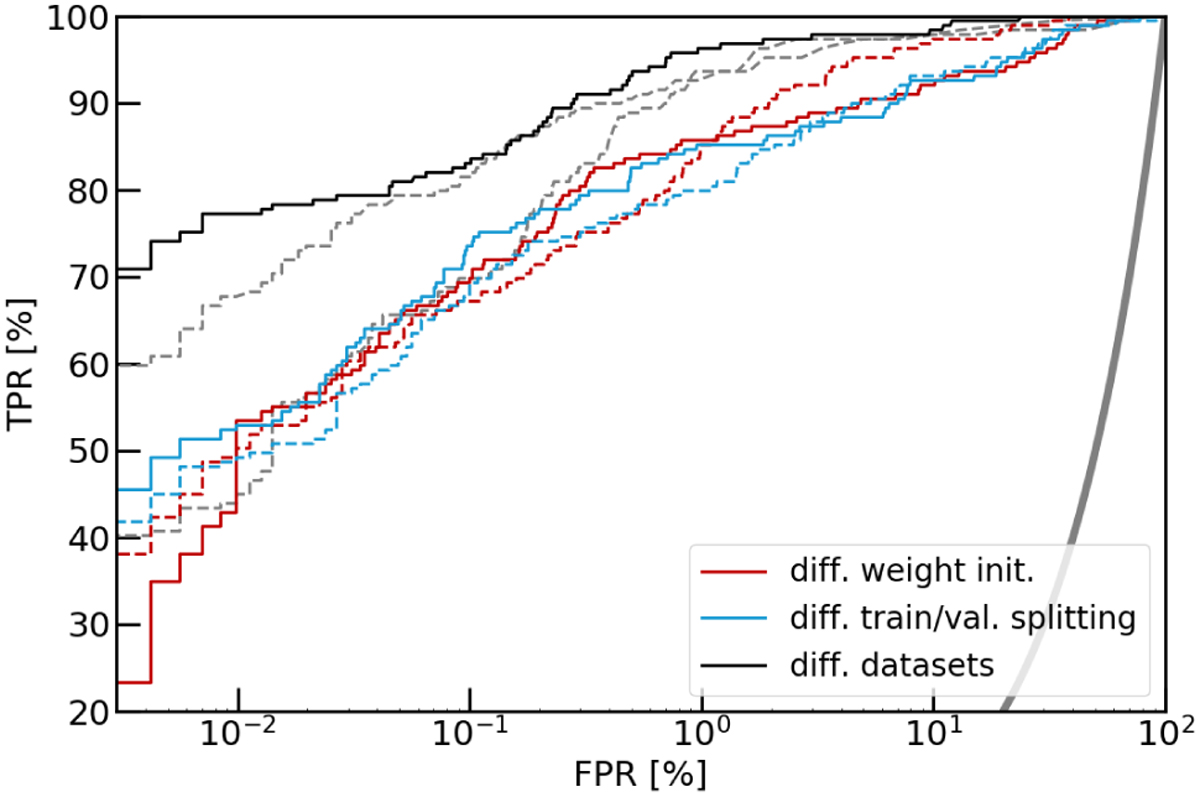
Fig. 10
Download original image
Performance of committees of networks. The red curves show the committee of five networks with different weight initialization. The blue curves instead use fixed architecture and ground-truth data, but random split into training and validation, and different weight initialization. Black curves show a committee of networks trained on different data sets (see Section 5.10). As in previous plots, solid and dashed lines correspond to the CNN and ResNet architectures, respectively. The third approach gives the most significant boost in performance and allowed us to overcome the AUROC, TPR0 and TPR10 of the best individual networks shown as gray lines (the baseline ResNet and the ResNet from C21
Current usage metrics show cumulative count of Article Views (full-text article views including HTML views, PDF and ePub downloads, according to the available data) and Abstracts Views on Vision4Press platform.
Data correspond to usage on the plateform after 2015. The current usage metrics is available 48-96 hours after online publication and is updated daily on week days.
Initial download of the metrics may take a while.