Fig. 9
Download original image
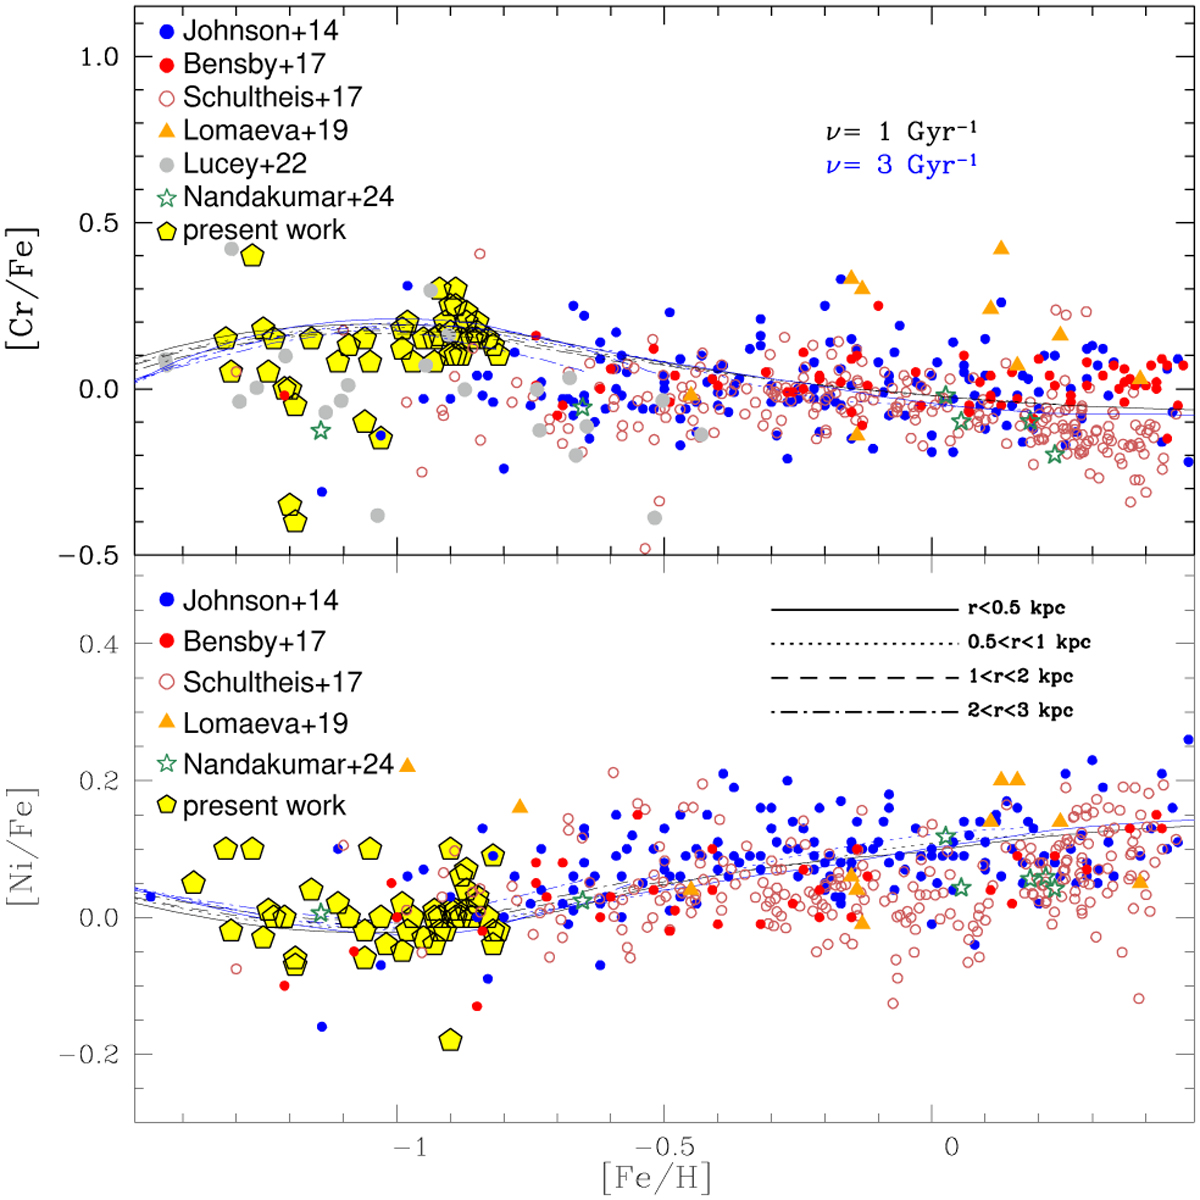
[Cr/Fe] vs. [Fe/H] (upper panel) and [Ni/Fe] vs. [Fe/H] (lower panel). Chemical-evolution models with SFR of ν = 1 and 3 Gyr−1 (black and blue lines respectively) overplotted on the results of the present study (yellow pentagons) and literature data: Johnson et al. (2014) (blue filled circles), Bensby et al. (2017) (red filled circles), Schultheis et al. (2017) (open red circles), Lomaeva et al. (2019) (filled orange triangles), and Lucey et al. (2022) (grey filled circles, only for Ni). Different model lines are for the same radii from the Galactic centre as in Fig. 8.
Current usage metrics show cumulative count of Article Views (full-text article views including HTML views, PDF and ePub downloads, according to the available data) and Abstracts Views on Vision4Press platform.
Data correspond to usage on the plateform after 2015. The current usage metrics is available 48-96 hours after online publication and is updated daily on week days.
Initial download of the metrics may take a while.