Fig. 8
Download original image
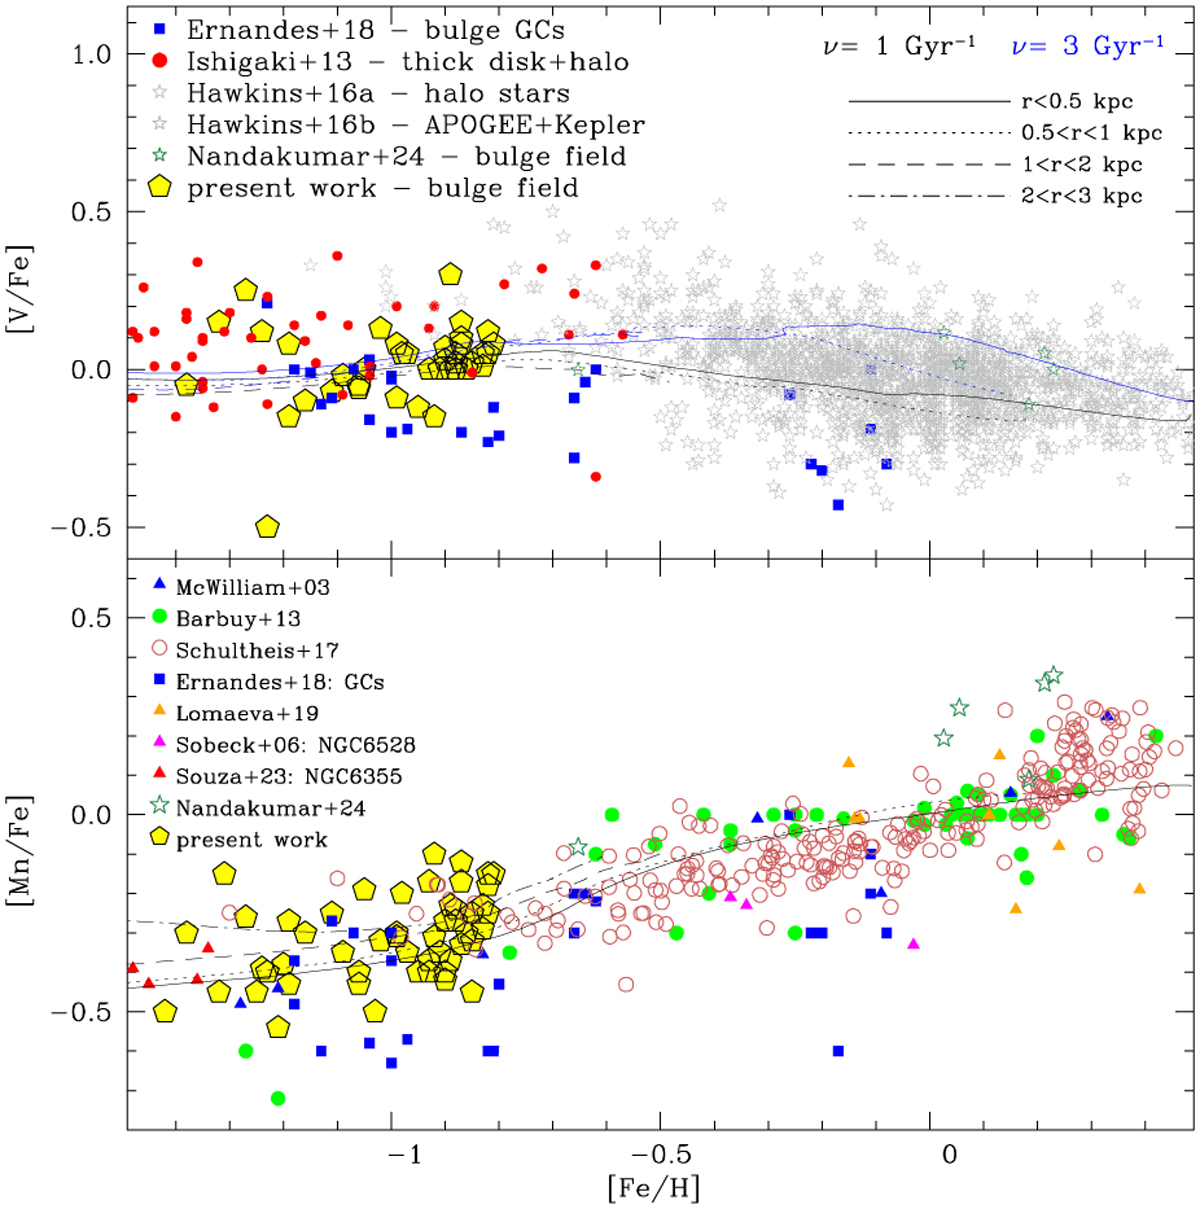
[V/Fe] vs. [Fe/H] (upper panel) and [Mn/Fe] vs. [Fe/H] (lower panel): Chemical-evolution models with SFR of ν = 1 and 3 Gyr−1 (black and blue lines respectively) overplotted on the results of the present study (yellow pentagons) and literature data. Bulge GCs are from Ernandes et al. (2018) (blue squares), bulge field stars are from Nandakumar et al. (2024) (sea green open stars). For V: thick disc and halo stars from Ishigaki et al. (2013) (red filled circles), halo stars from Hawkins et al. (2016a), and disc stars from Kepler+APOGEE given in Hawkins et al. (2016b) (bold grey open stars). For Mn: bulge field data from Lomaeva et al. (2019) (filled orange triangles), Schultheis et al. (2017) (open red circles), Barbuy et al. (2013) (filled green circles), McWilliam et al. (2003) (filled blue triangles), and GCs NGC 6528 by Sobeck et al. (2006) (filled magenta triangles), NGC 6355 by Souza et al. (2023) (filled red triangles). Different model lines correspond to the outputs of models computed for radii r < 0.5, 0.5 < r < 1, 1 < r < 2, and 2 < r < 3 kpc from the Galactic centre.
Current usage metrics show cumulative count of Article Views (full-text article views including HTML views, PDF and ePub downloads, according to the available data) and Abstracts Views on Vision4Press platform.
Data correspond to usage on the plateform after 2015. The current usage metrics is available 48-96 hours after online publication and is updated daily on week days.
Initial download of the metrics may take a while.